TopxAI
Opening page
Opening page
Loading product details
1st edition · EN + ZH PDFs · 33 figures, 128 tables · three-horizon view · fully derived target · three review rounds
All registered calls, verification criteria and revisions are retained. Linked reports may have newer editions; read historical calls with their registration dates and revision notes.
The gross-margin lift is a synchronized, industry-wide lift under tight supply: of the +12.32pp GAAP sequential rise, 7.84pp is an accounting low base; of the +14.8pp non-GAAP year-on-year rise, the filings can quantify only 1.4–2.8pp, and the 12–13pp residual cannot be split (Chapter 6)
A 10-Q or earnings release for 2026Q3 or Q4 quantifies a company-specific driver (pricing, yield, precious-metal recovery) of ≥ 5pp; or, while Technoprobe's and MJC's gross margins fall back ≥ 3pp, FORM's company-basis non-GAAP gross margin (excluding IEEPA refunds) stays at or above this report's base-case marker for the same quarter for two quarters running (2026Q4 51.0%, 2027Q1 47.9%, 2027Q2 48.0%) (observation point: 2026-11 (Q3 10-Q, Technoprobe 9M, MJC Q3); 2027-02; 2027-05 / 2027-08 (2027Q1 / Q2 10-Q); settlement: 2027-09-22 / 12 months)
SOXX total return
No settlement evidence recorded yet.
HBM is probabilistic: the filings disclose no customer long-term agreement, prepayment, capacity reservation or minimum-purchase clause, RPO is $10.8m, and share follows customers' wafer starts quarter by quarter; SK hynix's upper bound is 73.8% of DRAM, and HBM is about $56.7m ± $3.0m (Chapter 5)
An 8-K Item 1.01 discloses a multi-year supply agreement, or RPO jumps above half a quarter's revenue because probe cards are included; or the 10-Q 2026Q3 shows DRAM and SK hynix's share rising together in the quarter customers shift to DDR (observation point: 2026-11 (Q3 10-Q); 8-Ks through 2027-09-22; settlement: 2027-09-22 / 12 months)
SOXX total return
No settlement evidence recorded yet.
Share is being lost in logic and AI accelerators, while the memory line is level with MJC: four-company panel share 38.0% → 27.3% over ten quarters, and both memory lines +40.4% in 2026Q2 (Chapter 4)
FORM's Foundry & Logic dollar growth is at or above Technoprobe's dollar growth for two quarters running (2026Q3, Q4); or panel share returns above 2026Q1's 32.8% (observation point: 2026-11; 2027-03 (Technoprobe FY2026); settlement: 2027-09-22 / 12 months)
SOXX total return
No settlement evidence recorded yet.
The mechanical drag from Farmers Branch prints before the 2030 target does: 3.1–4.8pp gross, −2.9pp net in the model's base case for FY2027; this report's base-case FY2027 EPS of $2.84 is 13.0% below consensus of $3.26, which reflects the drag only in part (Chapters 6 and 14)
2027Q2 actual Zacks-basis EPS ≥ consensus of $0.78 and the converted Q3'27 guidance midpoint ≥ $0.84 (central gap invalidated, migration box item 3); or the 10-K FY2026 shows start-up delayed beyond FY2027 Q2 (observation point: 2027-02 (10-K); end of 2027-04 (Q2'27 guidance); end of 2027-07 (2027Q2 results); settlement: 2027-09-22 / 12 months)
SOXX total return
No settlement evidence recorded yet.
Financial quality: TTM cash conversion of earnings 1.56x, no anomalies in working capital; what has to be read alongside is restructuring in 9 of 11 fiscal years and dilution-offset cash at 1.23 times SBC (Chapter 7)
TTM operating cash flow ÷ net income falls below 1.0, or average-basis DSO leaves its 40–72-day range since 2011 (observation point: every quarter from 2027-02 to 2027-08 (10-Q 2027Q2); settlement: 2027-09-22 / 12 months)
SOXX total return
No settlement evidence recorded yet.
Return on capital: net cash $334m, no net debt, six-year incremental ROIC 3.8%; Farmers Branch first raises invested capital by $115–170m, and the return is unobservable before 2027 (Chapter 8)
TTM after-tax ROIC for 2027Q3 (on the Chapter 8 basis) at or above 14.1%, i.e. the new invested capital earns back the existing rate of return in its ramp year (observation point: around 2027-11 (10-Q 2027Q3); settlement: around 2027-11-05 (10-Q 2027Q3) / 15 months)
SOXX total return
No settlement evidence recorded yet.
Governance: no controlling holder (one share, one vote; largest single holder BlackRock at 12.4%), zero insider open-market buying in 12 months, and incentives do not measure return on capital (Chapter 9)
The 2027 proxy adds ROIC or free cash flow to the bonus or PRSU metrics; or any executive officer or director buys in the open market (observation point: 2027-04 (proxy); Form 4s through 2027-09-22; settlement: 2027-09-22 / 12 months)
SOXX total return
No settlement evidence recorded yet.
Valuation and rating: Neutral (watch grade), 12-month price target $133.68 (the base-case price, −2.8% relative to SOXX); the E1 reading on the rating basis (consensus compounded at the required return) is FY2030 EPS of $4.75, with no evidenced direction against the $5 target, so the report is written as a structural guide; structurally expensive on the same-yardstick DCF (implied return 6.03% against 10.82%, a structural observation that does not enter this conclusion's settlement) (Chapter 12)
Item 1 or 2 (either) of the Chapter 1 migration box triggers; a thesis-failure price (migration box item 4) is crossed; at settlement on 2027-09-22 the relative total return lies outside −10% to +5%: recorded as a miss (observation point: after each quarter's results; daily (β-adjusted ratio); 2027-09-22; settlement: 2027-09-22 / 12 months)
SOXX total return
No settlement evidence recorded yet.
Method: every call registered in the period is shown — nothing is selected out. Hit rate = hits ÷ (hits + misses); open calls are excluded from the denominator. Outcomes are judged against the falsification conditions stated in each report. Past performance does not indicate future results. Not investment advice.
FormFactor, Inc. (Nasdaq: FORM) company deep dive, first edition. Two PDFs — Chinese (224 pp) and English (289 pp) — each with 16 chapters plus 4 appendices, 33 figures and 128 data tables, table-for-table consistent across the two versions; every computed number is derived in Appendix D. Data as of the 2026-09-22 close; financials to 2026-06-27 (10-Q filed 2026-08-04); filing cutoff 2026-09-22.
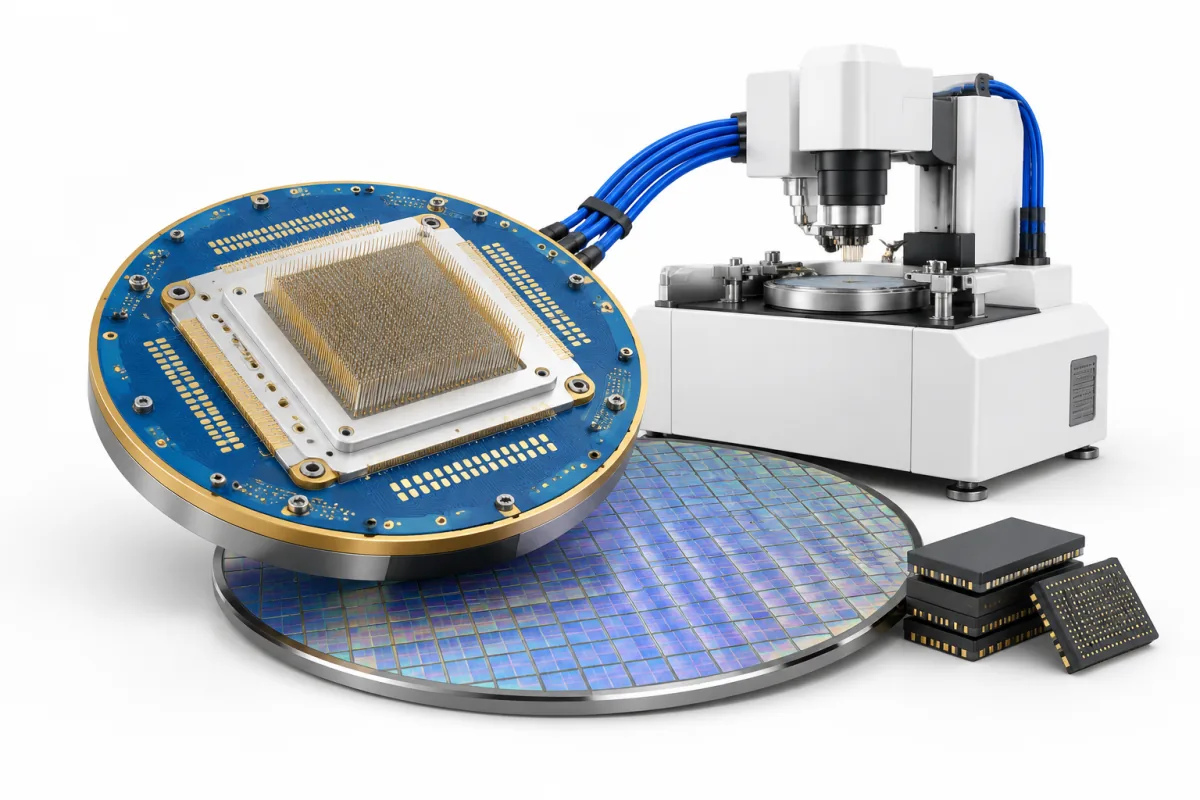
Probe cards make up 81.2% of FormFactor's revenue: each is custom-built for one customer chip design, wears down with every wafer touchdown and is scrapped when the design changes. They brought in $209.7m in 2026Q2, yet the filings contain not one filed customer contract, and RPO is $10.8m. Over the past year non-GAAP gross margin rose from 38.5% to 53.3%; over ten quarters FORM's share of a dollar panel of the four listed probe-card makers fell from 38.0% to 27.3%. Both are true at once, which leaves three questions: how much of the margin lift belongs to FORM, how much is the whole industry moving together and how much is an accounting low base; in which lines the share was lost; and how much drag the Farmers Branch plant, bought in 2025-06 for $55.0m, will print once it starts production, before the company's 2030 targets from its 2026-05-11 investor day (revenue $1.6bn, non-GAAP gross margin 55%, non-GAAP EPS $5) can be tested. The report takes the filings apart item by item: of the +14.8pp year-on-year rise only 1.4–2.8pp can be quantified; of the +12.32pp GAAP sequential jump, 7.84pp is the low base left by restructuring; Technoprobe printed 57.2% and MJC 53.8% in the same quarter; the share loss is in logic and AI accelerators, while the memory line grew +40.4%, level with MJC; and the new plant's mechanical gross-margin drag comes to 3.1–4.8pp. The report is built as a structural guide (the gross-margin bridge, the customer and share series, the Farmers Branch accounting clock and the peer mirror), with falsification conditions and tracking indicators attached.
| Chapter | Specific result |
|---|---|
| 1 | A nine-tile dashboard, each tile with a multi-period series and a comparator; eight core conclusions, each graded for evidence strength and matched one for one to the falsification conditions in Chapter 16; three horizons (monthly / quarterly / annual), each with its own settlement rule, and migration triggers written in advance; the annual rating settles on the ratio of FORM's to SOXX's market total return |
| 2, 3 | The two segments and eight drivers of probe-card demand; how it gets paid: 98.6% recognized at shipment, collected in about 55 days, RPO down from $30.3m to $10.8m in two quarters; ≥10% customers quarter by quarter (Intel off the list from 20.8%, SK hynix up to 29.5%); a ten-year correlation of only 0.17 between Intel's capex and FORM's revenue from Intel; revenue at or above the guidance midpoint in 13 of 15 quarters; about 3.0pp of the Q3 gross-margin guidance is a one-off refund |
| 4, 5 | A dollar panel of the four listed probe-card makers (FORM's share 38.0% → 27.3% in ten quarters) and a line-by-line mirror (memory level with MJC at +40.4%, F&L 46.2pp behind Technoprobe); TechInsights shares against self-calculated shares; three bargaining-power indicators and six moat mechanisms; how HBM probe-card revenue of about $56.7m a quarter (±$3.0m) is pieced together when the company does not disclose it; seven readings of SK hynix dependence; the evidence chain for a second HBM4 customer |
| 6 | Four plants becoming three, with restructuring charges of $32–40m; the Farmers Branch accounting clock and its 3.1–4.8pp mechanical gross-margin drag in 2027; the bridge for the +12.32pp GAAP sequential jump (7.84pp a restructuring reversal); the bridge for the +14.8pp non-GAAP year-on-year rise (1.4–2.8pp quantifiable, a 12–13pp residual that cannot be split); the IEEPA refunds inside the 54.0% Q3 guidance; the conditions for delivering the 2030 target |
| 7, 8 | Segments quarter by quarter and revenue growth broken down; working-capital days; the GAAP-to-non-GAAP net income bridge and ten one-off items since 2018; the dilution-offset cash cost of SBC (1.23 times SBC expense over FY2021–FY2025); nine accounting red-flag checks; debt by instrument, $334m of net cash and the full-dilution table; the ROIC series (14.1% TTM after tax, 3.8% incremental over six years); employees and productivity; where capex went; a ledger of 8 acquisitions or equity investments |
| 9 | Holders above 5% and a six-rung passive-holding ladder; the 2026 annual-meeting votes and control provisions; the board director by director; pay structure (70% of the bonus on quarterly adjusted operating income, with no ROIC or free-cash-flow metric); Form 4 trade by trade (228,000 shares and $22.05m sold in the open market in 12 months, zero bought); the CEO's 10b5-1 plan timeline; incentive stock and burn rate |
| 10, 11 | Six operating mirrors on growth, margins, TTM quality and capex intensity; the valuation snapshot and percentiles (EV/revenue at the 95.0th percentile of its own five years); sell-side consensus rebuilt quarter by quarter; five kinds of mispricing evidence: price reverse-engineering (the rating-basis reading beside fixed-multiple readings), an event study of earnings days and the investor day, peer dislocation, the options-implied distribution and a β decomposition; ten variables reconciled against the price |
| 12, 13 | Valuation inputs and a quarter-by-quarter cash ledger for all three scenarios (site spending funded without drawdowns or share issuance); the rating basis (SOXX's same-yardstick implied return and a β of 1.39); the three-scenario price ladder and probability bases; 26 rows of ±30% sensitivity and ±10pp weights; the same-yardstick DCF and CAPM absolute value; an item-by-item reconciliation with market-implied values; certainty layers, bull and bear side by side, quarterly markers, triggers and handling, the four decision items and a review calendar |
| 14, 15, 16 | A seventeen-item risk register ranked by when each first becomes observable; twelve easily misread numbers, plus ten numbers altered as they passed through transcripts, aggregators and XBRL tags; falsification conditions for the eight core conclusions; eight dated catalysts inside 12 months; five ★★★ tracking indicators and the linchpin variable |
Three groups of adversarial review raised 181 challenges: 55 from a four-perspective review of the valuation model (rating framework / input evidence / mechanics and one set of books / a bull-side rebuttal), 73 from the first four-track internal review (finance and valuation / contracts and governance / rating settlement / copy) and 53 from the second two-track internal review (a skeptic's review / the English edition). All 92 substantive revisions are published in Appendix C, Table 128. One of them changes how the conclusions can be proved wrong and belongs up front: the migration rule and the thesis-failure prices were reset after the second round. Migration used to hold the numerator fixed at one base-case reading; it now runs on the central gap α (this report's base-case target-date window EPS over consensus, minus 1), with the numerator updated each quarter by a pre-set proportional rule (Appendix C, row 67). The thesis-failure prices used to be two lines on the FORM / SOXX price ratio, namely the upside and downside scenarios' relative prices, which in the same simulation would trigger within 12 months 54.3% of the time on the upper side and 3.2% on the lower, and the upper line could be crossed on sector β alone. The fourth version of the valuation model redefines them on a ratio with the β of 1.39 stripped out, placing each line where it has about a 10% chance of triggering within 12 months at a zero central gap (8.8% upper and 11.5% lower on the rating basis; row 88). The target price and the three scenario prices and probabilities are unchanged in the fourth version.
Primary sources: SEC EDGAR (CIK 0001039399), namely 10-Ks for FY2010 and every year since FY2013, the 10-Qs from 2024 on, earnings releases (8-K EX-99.01) for 2021Q1–2026Q2 and other 8-Ks, the full text of the $150m secured revolving credit agreement, DEF 14A, 55 Form 4 filings and Form 144, 13G / 13G/A, S-8, Form D, an SEC comment letter and XBRL companyfacts. Probe-card peers Technoprobe, MJC, JEM and MPI and partners Keystone Microtech, Advantest and FICT are read from their own reports and announcements; customers SK hynix, Samsung, TSMC, Micron, Intel and NVIDIA from their primary results materials; plus US peers' filings and proxies, Federal Register BIS rules and the Section 232 proclamation, price, short-interest, option and rate data from Nasdaq, FINRA, CBOE, the US Treasury and the ECB, and iShares SOXX and other ETF holdings. Management's statements come only through third-party call transcripts ([B]); the investor-day presentation itself could not be obtained, and the report involves no management interviews, expert network or site visits. Every claim carries an [A]/[B]/[C]/[D] evidence grade; known limitations and data gaps are listed item by item in Appendix B, 38 in all.
Compiled independently by the TopX research team from public information, then reviewed and revised before release by professional investment managers and fund managers with asset-management experience. Reviewers take part in a personal capacity, do not represent their respective employers, and provide no investment advisory services through TopXEA; TopXEA holds no investment-adviser licence in any jurisdiction. Primary filings (SEC, exchanges, company disclosures) are the first-priority source, key figures require corroboration from at least two independent sources, claims carry [A]/[B]/[C]/[D] evidence grades, and known limitations are disclosed item by item inside the report. This is research content: it does not constitute investment advice, an offer or a solicitation and is not tailored to any particular investor. Ratings and target prices are analytical judgments, not instructions to buy or sell; past data and forward projections do not indicate future results.
Conflicts of interest: (1) positions held by the publisher or its affiliates in the subject security: none; (2) business relationship with the subject company or its affiliates: none; (3) the publisher also operates the sale of Expert Advisors (automated trading software, including the EA VIP membership), parameter presets and strategy source code, the TopxAI AI-model API relay service (ai.topxea.com), and TopxAI API credit cards (prepaid credit codes), which have no relationship to the subject; (4) this report is paid for by readers, not by the subject company.
Please note before purchase: digital goods are non-refundable once delivered.
Compound today's price at the required return to the end of 2029, divide by the current forward multiple, and the 2030 EPS that comes out tends to be called “price-implied”. But that multiple is itself price divided by consensus, so the price cancels and the reading is simply consensus compounded at the required return. Using FormFactor's numbers, this piece shows the trap, how to check for it, and where the price information actually sits.
A bitcoin miner books the coins it mines as revenue, but coins are not cash, and the proceeds from selling them can sit in investing activities. Operating cash flow is therefore negative by construction. Using ten quarters of Riot Platforms filings, this piece lays out three lines to read side by side, and explains why a widely quoted non-GAAP figure swings with the bitcoin price.
We parsed all 90 of Vertiv's (NYSE: VRT) Forms 4 over twelve months, 150 transactions, one at a time. Strip out cashless exercises and net accumulators and the usable figure is $100.8m — of which 91.9% came from the board, while the CEO and CFO sold nothing. Reproducible steps included.
We pulled and read both of Palantir's 20 August Forms 144. A Form 144 is a notice of intent, not a sale; one filing names its 10b5-1 adoption date and the other leaves the field blank — and that field is where all the information sits. Plus a share-count trap that understates price-to-sales by 4.3%.