TopxAI
Opening page
Opening page
Loading product details
1st edition · EN + ZH PDFs · 40 figures, 151 tables · three-horizon view · fully derived target · three review rounds
All registered calls, verification criteria and revisions are retained. Linked reports may have newer editions; read historical calls with their registration dates and revision notes.
Not one contract locks in future revenue; on the cost side $480.2m already sits on the balance sheet undepreciated, and a further $173.3m of leases is signed but not commenced.
An 8-K Item 1.01 disclosing a multi-year supply agreement with a minimum purchase volume or prepayment (the three-year long-term agreement management has spoken of); or contract liabilities plus customer prepayments rising above 10% of quarterly revenue; or the company starting to disclose RPO (observation point: 8-K at any time; each quarterly 10-Q)
Equal-weighted LITE / COHR / FN total return
No settlement evidence recorded yet.
Management's record on product-level forward calls is 0 / 5 delivered in full; the two that can be binned sit between 0.51 and 0.71, and the longer the horizon, the lower the delivery.
A forward figure with a horizon of at least 4 months delivered in full: at product level, Q4 800G plus 1.6T against about $330m (an analyst's estimate that the CFO called "about right, directionally" [B]); the CEO's "Q4 revenue above $500m" is a total-revenue figure and serves as corroboration if it is met at the same time (observation point: around February 2027)
Equal-weighted LITE / COHR / FN total return
No settlement evidence recorded yet.
Digicomm's collection period of about 9 months (FIFO 256–329 days, about 8 to 11 months) has been the channel structure since the end of 2024, and the CATV leg has an end point in 2027.
FIFO days falling back below 180 while CATV revenue holds to guidance; or Charter extending its network evolution beyond 2027 and budgeting a separate 1.8 GHz phase (observation point: each quarterly 10-Q; Charter 10-Q and earnings release)
Equal-weighted LITE / COHR / FN total return
No settlement evidence recorded yet.
Dilution is not over: the base case adds 11.16m shares by the 2027-09-22 target date and needs about $378m of equity beyond the third ATM.
Non-equity funding that covers the gap beyond the third round arriving before the target date (strategic investment, customer prepayments or project debt totaling ≥ $380m), or the Q3 10-Q showing the third round largely unused while period-end cash stays above $400m (observation point: Q3 10-Q; 8-K at any time)
Equal-weighted LITE / COHR / FN total return
No settlement evidence recorded yet.
In-house laser chips have not turned into pricing power: Q2 2026 GAAP gross margin fell 2.6 percentage points y/y, the only decline among the six companies.
GAAP gross margin improving y/y for two quarters in a row, by no less than Lumentum and Zhongji Innolight (observation point: each quarterly 10-Q)
Equal-weighted LITE / COHR / FN total return
No settlement evidence recorded yet.
Management incentives are 100% tied to the share price; in 12 months insiders made zero open-market purchases and sold $124.5m, 82.6% of it outside 10b5-1 plans.
PSUs in the 2027 proxy adding a cash-flow, return-on-capital, per-share or dilution metric; or any NEO buying in the open market (observation point: the 2027 proxy; Form 4)
Equal-weighted LITE / COHR / FN total return
No settlement evidence recorded yet.
At base-case gross margin the price requires mid-2027 data center revenue to reach 73% of management's figure, above the 0.71 top of the binnable record; this is the report's only bearish reason, and it supports no more than a watch-grade Underweight.
Fundamentals: Q2 2027 data center revenue and GAAP gross margin for the quarter landing above the market-implied frontier (test points in Section 13.7), settled early on the 10-Q publication date; price: (1 + AAOI total return) ÷ (1 + basket total return) ≥ 2.333 for 20 consecutive trading days (equivalent to an AAOI close of $249.61 with the basket unchanged), settled early on the 20th trading day; both recorded as a miss (observation point: around August 2027; price daily; settled at maturity on 2027-09-22)
Equal-weighted LITE / COHR / FN total return
No settlement evidence recorded yet.
Annual rating: Underweight (watch grade): probability-weighted $93.02, −13.1% vs. spot; −18.9% after the basket's same-yardstick expected return of 7.17% [C], inside the Underweight band (below −10%); evidence strength [C]
Settled on total return relative to the basket, method and criteria in Chapter 16 (< −10% recorded as a hit); invalidation and early settlement in Chapter 13. Start and settlement: from the 2026-09-22 close (AAOI $107.00; LITE $945.67, COHR $310.39, FN $403.80), settled at the 2027-09-22 close. Early settlement on two grounds, both recorded as a miss: ① fundamental failure (the Q2 2027 frontier, test points in Section 13.7, on the 10-Q publication date); ② price failure: (1 + AAOI total return) ÷ (1 + basket total return) ≥ 2.333 for 20 consecutive trading days, settled on the 20th trading day
Equal-weighted LITE / COHR / FN total return
No settlement evidence recorded yet.
Method: every call registered in the period is shown — nothing is selected out. Hit rate = hits ÷ (hits + misses); open calls are excluded from the denominator. Outcomes are judged against the falsification conditions stated in each report. Past performance does not indicate future results. Not investment advice.
Applied Optoelectronics, Inc. (Nasdaq: AAOI) company deep dive, first edition. Two PDFs, Chinese (230 pp) and English (296 pp), each with 16 chapters plus 4 appendices and 40 figures and 151 data tables, table-for-table consistent across the two versions; every computed number is derived in Appendix D. Data as of the close on 2026-09-22; financials to 2026-06-30 (10-Q filed 2026-08-06); filing cutoff 2026-09-22, later filings excluded.
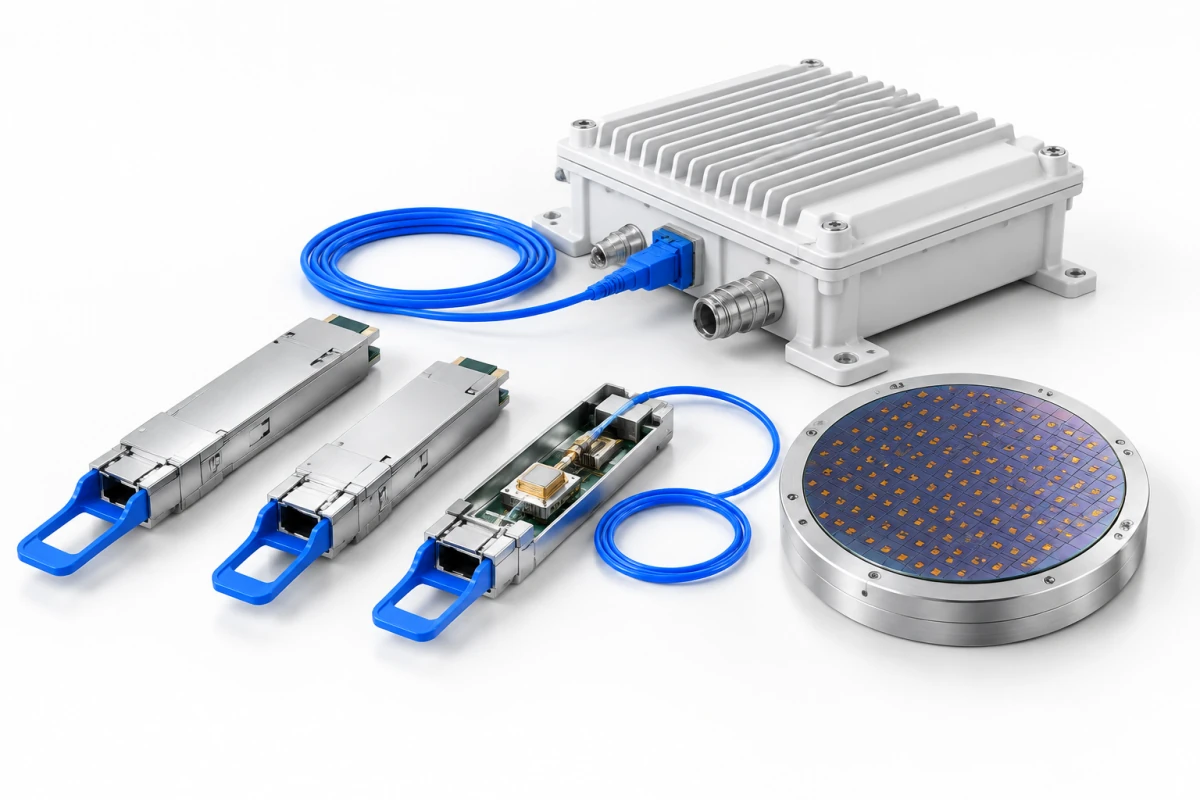
AAOI sells two kinds of hardware by the unit: 100G to 1.6T optical modules for hyperscale data centers, and CATV amplifiers sold through a distributor to cable operators; in Q2 2026 they were 56.1% and 42.0% of revenue. In two years the company doubled its share count and got capacity in Texas, Taiwan and Ningbo in return: from 2025 through H1 2026 it raised $1.547bn net through ATMs, 97.3% of its external funding. At 30 June 2026 the cost side already carried $480.2m of construction in progress and prepayments on the balance sheet, not yet depreciating, plus leases signed but not yet commenced with $173.3m of ten-year base rent. The revenue side had not one contract that locks in future revenue: contract liabilities were zero, RPO is not disclosed, and of Customer C's announced $324m of orders at most $12.8m had been delivered by 30 June. The CATV half is sold in through a single distributor, Digicomm, recognized on shipment and collected in about 9 months, with $211.0m receivable at 30 June; the end customer, Charter, states that its network evolution completes in 2027. The report answers three questions: how fast, and in what proportion, capacity bought with equity turns into revenue and cash; how far management's figures should be discounted after five product-level forward calls, none delivered in full; and what delivery ratio the share price already assumes.
| Chapter | Specific result |
|---|---|
| 2, 3 | Who buys each leg, from which budget, and how fast they pay (data center 57–88 days, CATV about 9 months); six quarters of net ATM proceeds matched quarter by quarter to capital spending; the seven lags from equity to collected cash, calibrated on cases that have already happened; nine years of ≥10% customers and a quarterly reconstruction; the Amazon warrant's accounting count reconciled separately from its legal vesting; narrowing down Customer C; the press-release order ledger and six substitutes for RPO; a breakdown of Q3 guidance and a table of how management's figures drifted |
| 4, 5 | Digicomm at 97–100% of CATV revenue, with receivable days of 256–329 on a FIFO basis; how lender BOKF carves the Digicomm receivable out of its borrowing base; Charter's upgrade spending and the precedent of CATV revenue falling 79% in five quarters from Q1 2023; upstream suppliers and financiers; the capacity ledger item by item ($480.2m on the balance sheet awaiting service, $173.3m of leases not yet commenced, $248.8m of purchase options on two phases and the company's exit route); the three-location capacity map and the delivery clock; about $67.4m a year of new fixed cost once assets enter service and leases commence |
| 6 | A slice of the chain: of four key inputs only the laser chip is made in-house; six independent sources on the InP laser shortage; the speed mix (800G at 11.9% of data center revenue) and management's 800G and 1.6T figures against actuals; the timing of LPO and CPO; the Chinese cost curve; tariff and geopolitical exposure; a falsifiable table of five moat claims |
| 7, 8 | Segments and margins quarter by quarter; all-in capex after the XBRL tag change; the tax line between GAAP and non-GAAP (an add-back in 20 of 22 quarters); the financials split into cause, process and result; nine earnings-quality checks; seven XBRL tagging errors; seven equity distribution agreements round by round (the same $100m of net proceeds took 5.76m shares in 2025 and only 550k in Q2 2026); interest-bearing debt and the redemption-notice window on the 2030 convertible; four share-count bases and EV; a monthly funding ledger, the financing toolkit and the range of further dilution |
| 9 | The charter and its 66⅔% threshold; holder structure; the control provisions inside the Amazon warrant; the board's ties to the ATM agent; incentives tied only to the share price; the timing of two severance and indemnification enhancements; twelve months of insider trades one by one ($124.5m sold, zero bought, 82.6% of the amount outside 10b5-1 plans); the change of auditor; shareholder votes |
| 10, 11 | Five peers on one basis over eight quarters, with industry-weighted growth; a substitute mirror for CATV; capex intensity, SBC and returns; share-count change against the sources of expansion funding; the valuation table and AAOI's own 5-year percentile; a reconstruction of sell-side consensus; five kinds of evidence: price reverse-engineering, event study, peer dislocation, options-implied distribution and holder structure |
| 12, 13 | The rating framework (one DCF yardstick for the basket and the stock); valuation inputs; the defining variables and annual results of three scenarios; target-date share count and net cash on one ledger; probability bases by bins of the Q2 2027 realization rate, with ±10pp tests; 22 single-variable ±30% tests; discount-rate, β and terminal-value variants; a line-by-line reconciliation with the market-implied view; certainty layers, bull and bear side by side, a scenario-to-action map, conditions for the view and for invalidation, and a review calendar |
| 14–16 | 18 risks ranked by observability, risks from a common source and the funding amplifier; five figures that are easy to misread; falsification conditions for all seven judgments, a catalyst path with eight dated nodes in 12 months, tracking indicators and proxy readings for the linchpin variable, and the settlement method |
| Appendices | A terms and definitions; B sources and 37 known limitations; C disclaimer, conflict disclosure and a revision log of 92 items; D derivations and calculations |
The valuation model was first reviewed from four angles (rating framework / input evidence / mechanics and one ledger / bull-case rebuttal); the finished text then went through two rounds of full-text review (round one on four tracks: financials and valuation / contracts, customers, counterparties and governance / tradability / presentation and wording; round two: a skeptic's rebuttal with a tradability re-check / English-edition consistency). Together they raised 186 challenges, and the 92 substantive revisions are published in Appendix C, Table 150. One of them moved the target price. The first review round found two problems: the convertible's redemption had been judged on the 2027-01-15 path price, whereas the indenture runs the price test over the 30 trading days before the redemption notice, and notice can be given from 2026-10-19 at the earliest; and probabilities were assigned to bins of the Q2 2027 realization rate while scenario prices were taken at the bin edges. The model now re-derives conversion timing and make-whole shares in all three scenarios from the indenture and prices each scenario at the conditional mean of its bin; together with two further model changes in the same round, the target moved from $77.09 to $93.02. The direction of the rating did not change, but the number of single-variable ±30% tests that flip it rose from two to seven.
Primary sources: SEC EDGAR (CIK 0001158114) 10-Ks for FY2019–FY2025, the 10-Qs and earnings releases; 8-Ks with exhibits (Microsoft's two SOWs, the Amazon transaction agreement and warrant, the 2030 convertible indenture, the BOKF loan agreement, the Hightower and Ningbo leases, two cleanroom general contracts); seven equity distribution agreements and eight 424B5s; DEF 14A; 133 raw Form 3 / 4 XML filings and 60 Form 144s; 22 13G / 13G/A filings; XBRL companyfacts. Also counterparty and peer filings from Charter, Comcast, Harmonic, Lumentum, Coherent, Fabrinet and others; the interim reports of Zhongji Innolight and Eoptolink; FINRA short-interest data, the Nasdaq options chain and 13F aggregates, and the US Treasury yield curve; earnings calls from public transcripts. Every claim carries an [A]/[B]/[C]/[D] evidence grade; 37 known limitations and data gaps are listed item by item in Appendix B, Table 149.
Compiled independently by the TopX research team from public information, then reviewed and revised before release by professional investment managers and fund managers with asset-management experience. Reviewers take part in a personal capacity, do not represent their respective employers, and provide no investment advisory services through TopXEA; TopXEA holds no investment-adviser licence in any jurisdiction. Primary filings (SEC, exchanges, company disclosures) are the first-priority source, key figures require corroboration from at least two independent sources, claims carry [A]/[B]/[C]/[D] evidence grades, and known limitations are disclosed item by item inside the report. This is research content: it does not constitute investment advice, an offer or a solicitation and is not tailored to any particular investor. Ratings and target prices are analytical judgments, not instructions to buy or sell; past data and forward projections do not indicate future results.
Conflicts of interest: (1) positions held by the publisher or its affiliates in the subject security: none; (2) business relationship with the subject company or its affiliates: none; (3) the publisher also operates the sale of Expert Advisors (automated trading software, including the EA VIP membership), parameter presets and strategy source code, the TopxAI AI-model API relay service (ai.topxea.com), and TopxAI API credit cards (prepaid credit codes), which have no relationship to the subject; (4) this report is paid for by readers, not by the subject company.
Please note before purchase: digital goods are non-refundable once delivered.
From early 2025 to June 2026, Applied Optoelectronics raised $1.547bn net by selling stock at the market, 97.3% of its external funding; customers prepaid nothing. This piece rebuilds a sources-and-uses ledger for that money by differencing year-to-date cash-flow figures, flags three places where pulling XBRL tags in bulk gets it wrong and one where the 10-K text reports a single month as a whole round, and compares where the peers found their expansion money. All of it can be reproduced from public filings.
Same EA, same .set, two different equity curves. We isolated the chart timeframe in a controlled test: 60× the bar count, and every figure in both reports came back identical. The variables that actually move the number are elsewhere — ranked by impact, with our own measured data.
A bitcoin miner books the coins it mines as revenue, but coins are not cash, and the proceeds from selling them can sit in investing activities. Operating cash flow is therefore negative by construction. Using ten quarters of Riot Platforms filings, this piece lays out three lines to read side by side, and explains why a widely quoted non-GAAP figure swings with the bitcoin price.
Compound today's price at the required return to the end of 2029, divide by the current forward multiple, and the 2030 EPS that comes out tends to be called “price-implied”. But that multiple is itself price divided by consensus, so the price cancels and the reading is simply consensus compounded at the required return. Using FormFactor's numbers, this piece shows the trap, how to check for it, and where the price information actually sits.