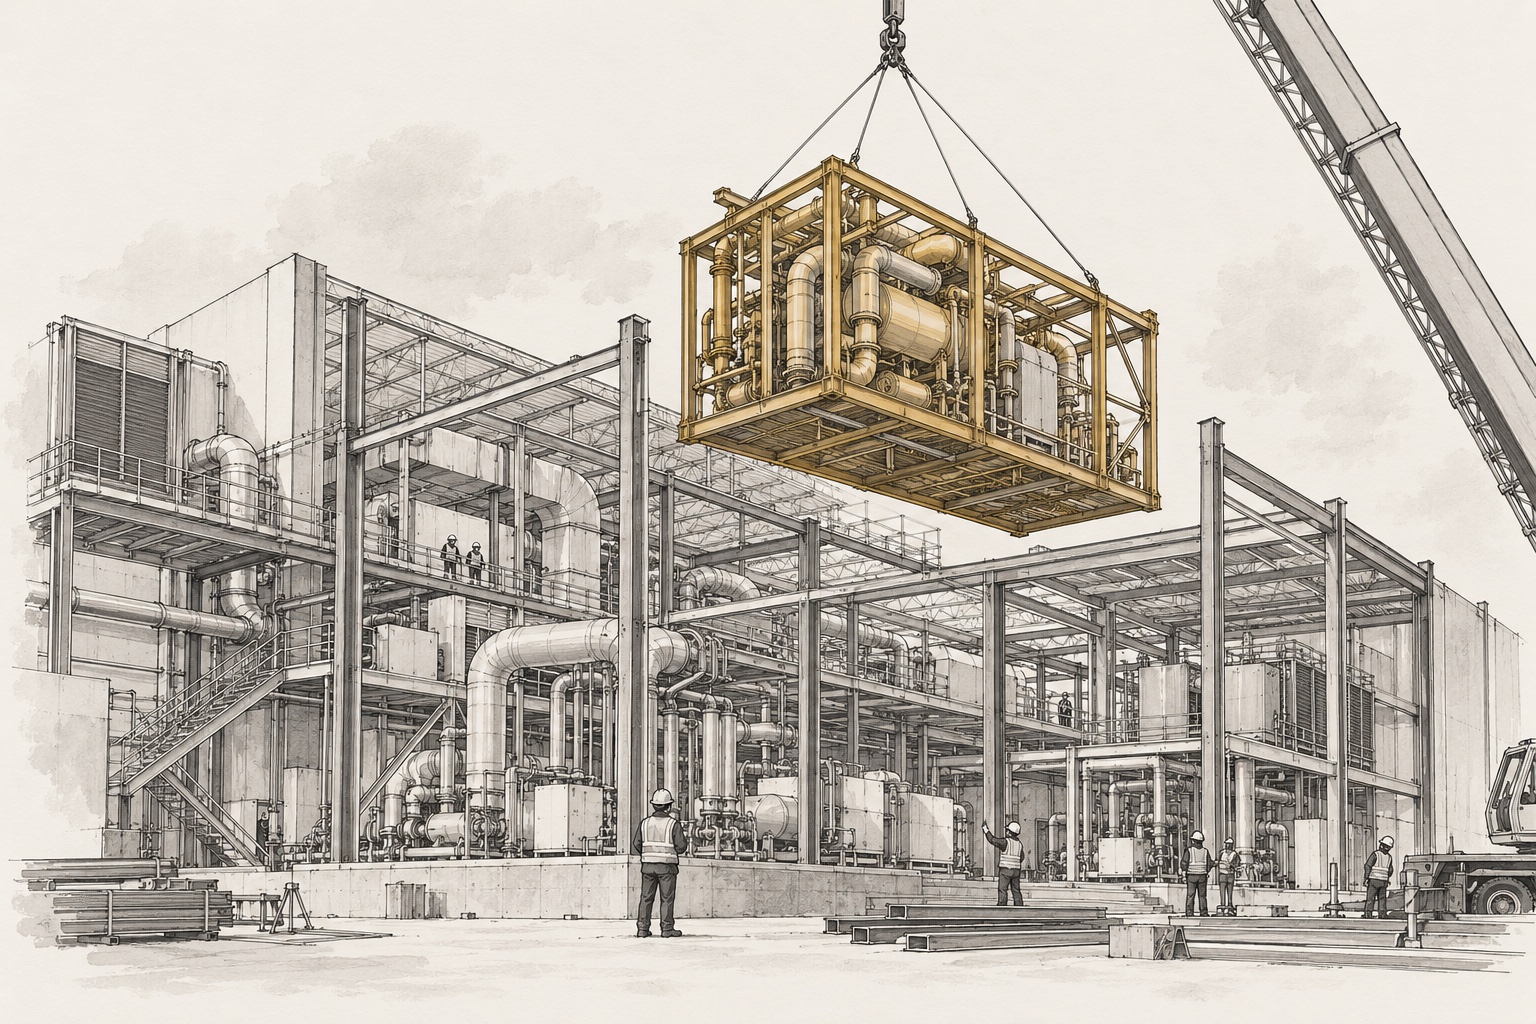
Comfort Systems USA (NYSE: FIX) has delivered operating improvements beyond growth in its order book. Technology customers accounted for nearly nine-tenths of its revenue increase in the first nine months of 2026. Both mechanical and electrical operations expanded, and the operating margin was substantially above those of two principal peers. Modular manufacturing, skilled workers and project management capabilities provide a foundation for delivering large projects. The respective contributions of business mix and delivery efficiency to profit have not been separately disclosed.
Shareholder returns still require two tests. The first concerns the contribution of customer advances to current cash flow and the funding needed for subsequent delivery. The second is the durability of current margins and whether additional capacity can continue to earn adequate returns. Of the $2.047bn in company-defined free cash flow for the first nine months, approximately $1.019bn came from the net cash contribution of changes in operating assets and liabilities. That contribution cannot simply be capitalized as a perpetual cash return.
Our assessment is that financial results support FIX's current growth and profitability, while the valuation still requires high margins and organic growth to persist for years. Under the consistent capital investment and discounting assumptions used here, a sustained operating margin of 15% would require approximately 21.1% annual revenue growth over the next five years to support the pre-earnings closing price of $1,279.37. At an 18% margin, the required growth rate falls to approximately 16.0%. The existing order book supports near-term expansion but cannot, by itself, establish profitability five years from now. The central valuation question is how long that performance can last, rather than whether all customer advances should be deducted from cash.
The price reference is the regular-session close of $1,279.37 on 2026-10-22. Financial data cover periods through 2026-09-30, the information cutoff is 2026-10-23 at 09:00 UTC, and the publication date is 2026-10-23. The third-quarter earnings Form 8-K was submitted after 16:10 Eastern Time on 2026-10-22, after the market close. We therefore do not interpret this price as the market's assessment after absorbing the new results. The 2026-10-23 earnings call is not included. All valuations below are conditional calculations, not live prices, probability forecasts or formal price targets.[1]
Construction capabilities convert capital budgets into revenue as technology customers reshape the business mix
FIX delivers mechanical, electrical, plumbing and related building systems. Some work is prefabricated in factories before being transported to sites for installation and commissioning. Customers pay for delivery and functioning systems. Revenue is generally recognized as performance obligations are satisfied, while equipment purchases, payroll, billing and cash collection occur at different times. The business model is constrained by both project execution capabilities and customers' capital budgets.
Independent data support the demand backdrop. The U.S. Census Bureau reported private data center construction spending at a seasonally adjusted annual rate of $84.950bn in 2026-08, up 73.2% year over year. The measure includes building electrical and mechanical systems, HVAC and backup power installations, but excludes servers, racks and land. It is therefore more relevant to a contractor's demand environment than aggregate AI capital expenditure. It remains a measure of nominal construction spending, not FIX's addressable market, and a single month's annualized rate is not spending already incurred over a full year.[2]
Turning capital budgets into FIX's earnings still requires projects ready to proceed, power and permits, contract awards, labor and materials, and final acceptance. A delay at any stage can change revenue recognition and collection schedules. FIX's position in the supply chain is shown in the TopXEA Industry Atlas; valuing the individual company requires further examination of its contracts and financial definitions.
View chart data
| Period | Technology | Other | Total |
|---|---|---|---|
| 2023 | 1.114 | 4.092 | 5.207 |
| 2024 | 2.331 | 4.696 | 7.027 |
| 2025 | 4.099 | 5.003 | 9.102 |
| TTM 2026Q3 | 7.188 | 5.355 | 12.543 |
In the first nine months, revenue from technology customers rose from $2.734bn in the prior-year period to $5.824bn, accounting for 89.8% of the total revenue increase. Revenue from other customers still grew 9.5%, indicating that the group is not relying on a single category merely to sustain its existing scale. This revenue mix suggests that future earnings may be more sensitive to the technology construction cycle. New construction accounted for 75.3% of revenue over the same period, while service calls, maintenance and monitoring together represented just 5.3%, including one-off repairs. FIX's revenue is predominantly tied to new construction, making earnings more sensitive to the building cycle than those of a service business centered on long-term maintenance contracts.[4]
The company's reported third-quarter revenue growth included 46.3 percentage points from same-store operations and 7.4 percentage points from acquisitions. Acquisitions therefore were not the principal driver of the strong growth. The same-store definition rolls acquisitions into the comparable base over time and may include small acquired businesses integrated into existing operating units. Public disclosures do not further separate the contributions of pricing, project volumes, materials resale and project mix.[5]
Modular construction depends on delivery coordination, while expansion still requires people and capital
Modular construction shifts some site work into a controlled factory environment, allowing design, procurement, manufacturing and site construction to proceed in parallel. Clear interface specifications, reliable material deliveries and coordinated factory and site schedules can shorten construction times, reduce site congestion and improve the reliability of cost estimates. Factory floor space alone does not produce these benefits; design and execution determine whether capacity is productive.
The expansion of FIX subsidiary EAS in Asheboro provides a specific example. In 2025-11, the North Carolina Department of Commerce announced plans for a subassembly plant of approximately 300,000 square feet, with an expected investment of $20m and 300 additional jobs. An EAS management interview in 2026-10 explained that the location had already been leased as a warehouse and was being converted to production use; existing control of the property helped accelerate its opening. Government incentives are payable subject to employment and investment conditions, rather than cash received when the project was announced. The case illustrates how capacity can be added, but does not establish plant utilization, revenue per square meter or investment returns.[6]
The pace of workforce development also limits expansion. FIX's year-end headcount increased from approximately 15,800 in 2023 to approximately 22,700 in 2025, while its 2026-08 investor materials indicated more than 25,000 employees. The U.S. Bureau of Labor Statistics identifies typical apprenticeships of four to five years for electricians and plumbers. Existing teams and training systems may therefore support a delivery advantage. However, net headcount additions include acquisitions, and group revenue includes materials and subcontracted work. Dividing revenue by year-end employees cannot establish the extent of any improvement in labor productivity.[7]
Prefabrication capabilities are not unique to FIX. EMCOR already operates electrical, piping, sheet metal and fire protection prefabrication networks. IES is converting recently acquired manufacturing facilities and expects some additional capacity to begin contributing meaningfully in fiscal 2027. These investments both corroborate demand and increase supply. FIX's long-term advantage must be demonstrated through contract wins, delivery, profitability and capital efficiency, rather than the modular construction label alone.[8]
Table 1 | Peer operating performance: first half of calendar 2026
| First half of calendar 2026 | FIX | EMCOR | IES |
|---|---|---|---|
| Revenue, $bn | 6.131 | 9.783 | 2.217 |
| Year-over-year revenue growth | 53.1% | 19.7% | 28.6% |
| GAAP operating margin | 17.02% | 9.72% | 13.12% |
| Purchases of property and equipment / revenue | 4.71% | 0.61% | 3.45% |
| Operating cash flow less purchases of property and equipment, $bn | 1.239 | 0.230 | 0.135 |
Table 1 uses a common reporting period. IES's first half of the calendar year is calculated by subtracting its first fiscal quarter from its fiscal nine-month figures. Its operating cash flow also includes $105.6m of net purchases of trading securities, so the final row should not be read as a ranking of construction cash flow. EMCOR's service operations and IES's residential and equipment manufacturing businesses also affect their consolidated margins; some peer segments have higher margins than FIX's consolidated business. The differences in the table demonstrate FIX's strong current performance but do not establish that proprietary technology accounts for the entire gap.[9]
Capital requirements are already changing. FIX spent $499.4m on property and equipment in the first nine months, substantially above $88.8m in the prior-year period. The company attributed the increase mainly to building purchases supporting growth in its mechanical business and expects elevated investment to continue into 2027. Public disclosures do not precisely separate maintenance, building purchases and expansion spending. A valuation should neither extrapolate historically low capital intensity indefinitely nor treat all current-year spending as maintenance expenditure that must recur annually.[10]
The order book improves near-term revenue visibility, but execution determines profit
The $17.81bn backlog at 2026-09-30 matches the construction business's remaining performance obligations and excludes unexercised options. The company expects 65% to 75% to convert into revenue over the following twelve months, equivalent to approximately $11.58bn to $13.36bn. These are firm orders with outstanding obligations recognized by the company, although it continues to warn that orders may be adjusted or canceled. The range describes only the expected conversion of orders outstanding at period-end; it is neither total revenue guidance nor a completion guarantee. Short-term service revenue and projects awarded and executed within a future period are not included.[11]
Project counts may understate concentration in large sites and customers. Of the 9,399 projects at 2026-09-30, 152 with contract values above $50m represented approximately 1.6% of the count but approximately 56.8% of total contract value, including work already performed. EAS also notes that a single site can involve multiple project numbers. A large project count therefore does not eliminate concentration in major customers, large sites or a common construction cycle. The largest customer contributed 12.8% of 2025 revenue. The public materials obtained for this research did not include current details of the five largest projects or individual cancellation and compensation provisions, preventing a precise calculation of potential losses from delays or cancellations.[12]
The size of the order book does not lock in gross profit. Projects typically carry a fixed overall price, and revenue recognition depends on estimated total costs and costs incurred. Labor efficiency, material deliveries, customer changes and subcontractor performance can all alter estimated costs to complete. Compensable change orders may increase revenue, while cost overruns that cannot be passed through remain with the contractor. If an entire project is expected to make a loss, the company must recognize the full estimated loss when it is identified.
View chart data
| Quarter | Gross | Operating | Revisions / revenue |
|---|---|---|---|
| 2024Q1 | 19.3% | 8.8% | 4.1% |
| 2024Q2 | 20.1% | 10.2% | 2.4% |
| 2024Q3 | 21.1% | 11.2% | 1.7% |
| 2024Q4 | 23.2% | 12.1% | — |
| 2025Q1 | 22.0% | 11.4% | 5.8% |
| 2025Q2 | 23.5% | 13.8% | 4.4% |
| 2025Q3 | 24.8% | 15.5% | 4.0% |
| 2025Q4 | 25.5% | 16.1% | — |
| 2026Q1 | 26.3% | 17.0% | 8.1% |
| 2026Q2 | 25.9% | 17.1% | 7.7% |
| 2026Q3 | 24.8% | 16.6% | 4.5% |
In the first nine months of 2026, estimate revisions contributed positively to revenue by 6.6%, compared with 4.6% in the prior-year period. The percentage warrants monitoring, but it is not a measure of inflated profit or an amount that can be deducted directly from net income. Removing the respective effects from both periods' revenue, using the disclosed percentages, still leaves approximately 50.1% growth. The company has not disclosed the full cost and cash effects associated with these revisions, so the difference cannot then be translated directly into adjusted operating profit.
The third quarter provides evidence against an overly pessimistic interpretation: the contribution of estimate revisions to revenue fell from 7.7% in the second quarter to 4.5%, while the operating margin remained at 16.6%. The third-quarter gross margin was approximately 24.8%, as in the prior year; the operating margin improvement therefore reflected revenue expansion and expense leverage to a greater extent. The research question is whether those execution gains can recur in subsequent projects, rather than whether every favorable change in cost estimates should be presumed unreliable.[14]
Receivables and advance billings must be assessed together to explain cash flow growth
Operating cash flow reached $2.538bn in the first nine months, nearly twice net income. Changes in operating assets and liabilities accounted for the largest part of the difference. Billings in excess of costs and deferred revenue contributed $1.693bn of cash, while receivables absorbed $1.167bn; increases in accounts payable and other current liabilities provided additional funding. Focusing on any one of these lines would give an incomplete view of cash flow quality.
View chart data
| Item | Change | Running total |
|---|---|---|
| Net income | 1.301 | 1.301 |
| Noncash / other adjustments | 0.218 | 1.519 |
| Excess billings / deferred revenue | 1.693 | 3.212 |
| Payables / other current liabilities | 0.681 | 3.893 |
| Increase in receivables | -1.167 | 2.726 |
| Other operating balance changes | -0.188 | 2.538 |
| Property / equipment purchases | -0.499 | 2.039 |
| Asset disposal proceeds | 0.008 | 2.047 |
Table 2 | From net income to company-defined free cash flow
| Cash flow bridge, $bn | Amount |
|---|---|
| Net income | 1.301 |
| Noncash and other adjustments | 0.218 |
| Net cash contribution from changes in operating assets and liabilities | 1.019 |
| Operating cash flow | 2.538 |
| Purchases of property and equipment | −0.499 |
| Proceeds from asset disposals | 0.008 |
| Company-defined free cash flow | 2.047 |
Setting all changes in operating assets and liabilities to zero produces a diagnostic free cash flow figure of $1.028bn for the period, using the same definition. This helps identify the sources of cash; it is not an estimate of sustainable free cash flow. Actual growth requires working capital, while taxes, leases, acquisition consideration and equity compensation also involve differences between cash and accounting recognition. Deducting only the contribution from advance billings would reduce free cash flow to $354m, while leaving in place the additional receivables and other funds committed to project execution. That result represents a stress case in which all other balances are unchanged and no incremental advance billings occur; it cannot be treated as normalized or sustainable free cash flow.
The company's 2023 and 2024 investor presentations already warned that pre-bookings and equipment advances would normalize as project costs were incurred, creating a cash flow headwind. The run-off of advances as work is performed is therefore a disclosed feature of the cash cycle. The relevant test is how net working capital requirements and margins evolve during that run-off. [16]
View chart data
| Quarter-end | Trade working capital |
|---|---|
| 2024Q1 | 0.059 |
| 2024Q2 | 0.182 |
| 2024Q3 | 0.149 |
| 2024Q4 | 0.304 |
| 2025Q1 | 0.310 |
| 2025Q2 | 0.467 |
| 2025Q3 | 0.295 |
| 2025Q4 | 0.057 |
| 2026Q1 | 0.099 |
| 2026Q2 | -0.338 |
| 2026Q3 | -0.516 |
Contract liabilities are not equivalent to cash already collected, nor can they be equated with cash held in trust across the group. At the end of September, cash and equivalents totaled $2.158bn, with a further $65.8m in short-term Treasury bills. The absence of a separate restricted-cash line does not establish that all these funds are immediately available for distribution: project payment obligations, credit agreement provisions and applicable law may still constrain their use. Public disclosures do not allow the group's cash to be traced to individual contracts. The valuation therefore makes its cash addback explicit and includes future working capital requirements in cash flow, avoiding a second deduction of the same fulfillment costs. [18]
Capital allocation requires the same consistency. In the first nine months, the company also spent $263m on acquisitions, net of cash acquired, paid $84m in dividends and used $346m of cash for share repurchases. None of these amounts is deducted in company-defined free cash flow. That measure is therefore distinct from either cash ultimately retained or distributions to shareholders. [19]
The price requires a combination of growth and margins
Using the disclosed common shares outstanding on 2026-10-16, the pre-earnings closing price implies an equity market capitalization of approximately $44.76bn. Trailing twelve-month operating profit was approximately $2.095bn, at an operating margin of 16.7%. The new disclosures strengthen the earnings base, but a trailing multiple alone cannot establish value. The analysis must connect future growth, reinvestment and normalized profitability.
We test those conditions with a ten-year discounted cash flow model of the enterprise. Revenue is multiplied by the operating margin to estimate operating profit, which is then taxed at a normalized rate of 25%. Depreciation and amortization of existing intangible assets are added back, before deducting fixed-asset investment and incremental working capital requirements. Cash investment in fixed assets is estimated as depreciation plus the increase in net fixed assets, so revenue growth requires additional investment at the assumed asset intensity. The reference case gradually increases net fixed assets as a share of revenue to 10%, rather than allowing revenue to double while funding only the existing asset base.
The model starts with the September-end financial balances. Annual forecast periods end on September 30 in subsequent years, with all cash flows discounted from period-end to October 22. Cash movements between September 30 and October 22 are not modeled separately. The reference discount rate of 10% is our required-return assumption, and long-term growth is set at 3%; neither is a precisely measured fact. All other assumptions are held constant in the reverse valuation below. [20]
Table 3 | Operating conditions that support the pre-earnings price
| Conditions that support $1,279.37 | Operating margin of 12% | Operating margin of 15% | Operating margin of 18% |
|---|---|---|---|
| Revenue CAGR over the first five years | 27.8% | 21.1% | 16.0% |
| Year-five revenue, $bn | 42.73 | 32.66 | 26.30 |
| Required technology revenue CAGR if other revenue grows 5% annually | 37.9% | 29.1% | 22.0% |
Table 3 is a reverse valuation under specified conditions, not a forecast. Each column holds its operating margin constant throughout the ten-year forecast and in perpetuity. After year five, annual revenue growth declines to 7%, 6%, 5%, 4% and 3%. Technology revenue follows the historical disclosure category and is not limited to data centers. The calculation includes organic growth only; future acquisitions would require separate treatment of both their cost and revenue contribution.
These results define the operating test. If margins fall to 15%, total revenue must increase to approximately 2.6 times its current level over five years. With modest growth in nontechnology revenue, technology revenue would have to expand faster. If an 18% margin can be sustained, the revenue requirement falls substantially. Supporting the current price does not require every variable to reach its most optimistic level, but it does require a matching combination of growth and margins of the kind shown in the table.
| CAGR | 12% | 15% | 18% |
|---|---|---|---|
| 10% | 683 | 853 | 1,024 |
| 15% | 818 | 1,026 | 1,235 |
| 20% | 976 | 1,230 | 1,484 |
| 25% | 1,163 | 1,469 | 1,776 |
| 30% | 1,380 | 1,748 | 2,116 |
10% discount rate, 3% terminal growth, 25% tax; other capital investment and cash-bridge assumptions held constant.
Sustained profitability can support the price, while the required return materially affects value
The reference case assumes 25% revenue growth in the first year, followed by gradual deceleration; the operating margin falls from 16.5% to 15%, and trade working capital conditions gradually normalize. Its conditional value is approximately $1,069 per share. The valuation is sensitive to the required return: reducing that assumption from 10% to 9%, with the operating path unchanged, raises the value to approximately $1,252, close to the pre-earnings price. Terminal value accounts for approximately 57.5% of enterprise value in the reference case and must be considered alongside the headline result.
Table 4 | Combined operating scenarios and two terminal valuation methods
| Conditional scenario | Principal growth and profitability assumptions | Ten-year cash flow method, $ per share | Year-five exit-multiple method, $ per share |
|---|---|---|---|
| Slower growth | Revenue CAGR of 4.1% over the first five years; margin falls to 12%; trade working capital returns to a net investment position, with a further $500m operating-balance settlement stress | 497 | 480 |
| Reference case | Revenue CAGR of 15.4% over the first five years; margin gradually falls to 15%; net fixed assets rise to 10% of revenue | 1,069 | 1,229 |
| Sustained profitability | Revenue CAGR of 24.8% over the first five years; margin rises to 18%; trade funding persists and fixed-asset turnover remains relatively high | 1,961 | 2,614 |
Table 4 assigns no probabilities and does not produce a weighted price target. The first method uses the full ten-year cash flow forecast and 3% long-term growth. The second uses only the first five years of cash flow and estimates exit enterprise value at 10, 14 and 18 times year-five operating profit, respectively. Those multiples are research assumptions, not current peer trading multiples. Both methods share the same initial operating inputs and are not independent sources of evidence. The difference between the two methods exceeds 30% in the optimistic scenario: the higher exit multiple embeds more favorable long-term growth or risk pricing, rather than providing greater confidence in the forecast. [20]
The capital model has an important limitation. Net fixed assets and trade working capital capture only part of the investment in operating capabilities; they cannot establish plant-level output, workforce development or returns on the full capital base. Rent, wages and training costs remain within operating margins. To test the terminal value's dependence on reinvestment, we separately estimate the investment required for long-term growth using assumed returns on total invested capital, replacing the original terminal-period net investment. At returns of 15%, 25% and 40%, the reference conditional values are approximately $968, $1,016 and $1,043, respectively, with cash flow for the first ten years unchanged. These returns are not company-disclosed ROIC. The test shows that greater long-term capital requirements reduce value even if margins are unchanged.
The strongest support for the company comes from operating results already delivered: rapid same-store growth, high margins despite a smaller third-quarter estimate adjustment, and an existing backlog that supports the following year's activity. An 18% margin exceeds the group's third-quarter operating margin of 16.6%. It requires further operating leverage or an improved project mix while absorbing expansion costs. Continued benefits from scale, modular execution and customer selection give the sustained-profitability case an operating rationale, but do not establish it as a proven long-term outcome.
Factory expansion alone cannot validate that case. Competitors are also building prefabrication capacity, large-project concentration can amplify the effects of cost-estimation errors, and new employees and facilities require time to become effective. The model funds fixed assets and trade working capital, but assumes no future acquisitions and does not include company-level disclosures of plant utilization or a complete forecast of other operating balances. Higher cash returns therefore remain conditional on organic capacity development; they do not mean growth no longer requires capital.
The duration of profitability can also be tested separately. With the reference revenue and capital paths unchanged, an 18% operating margin throughout the forecast and in perpetuity produces a conditional value of approximately $1,275. If the margin is maintained at 18% for only the first five years and falls to 15% from year six, value declines to approximately $1,110. Strong near-term earnings are important evidence, but a subsequent decline in margins materially affects value. The next year's backlog cannot substitute for that long-term judgment.
Trade funding should be assessed on the same scale. Maintaining the current ratio of net trade working capital funding throughout the reference case adds approximately $49 per share to conditional value. An additional $500m payment to settle operating balances, spread over two years, reduces value by approximately $12 per share. Within the trade working capital stresses presented here, these effects are smaller than those from margins, long-term growth and the required return. If all opening cash and short-term Treasury bills are retained for operations, with no additional equity-value addback, the reference conditional value falls to approximately $1,006, a reduction of $63. This is a valuation boundary test, not a determination that the cash is restricted, and it does not deduct the associated fulfillment expenditure a second time. Advance-payment normalization alone does not justify a large valuation reduction, nor can current free cash flow be extrapolated indefinitely.
Future results must establish the durability of margins and returns on expansion
Observable outcomes should determine the next revision to this assessment. A growing order book accompanied by declining project profitability would indicate that winning work has yet to translate into shareholder returns. If margins hold while cash flow temporarily declines as construction proceeds, the relevant test is the net funding requirement. One quarter of weaker cash flow alone would not invalidate the company's operating quality.
Table 5 | Evidence to monitor and implications for the assessment
| Observation window | Key evidence | Implications for this analysis |
|---|---|---|
| The 2026-10-23 earnings call and the next quarterly filing | Expansion plans for 2027, associated costs and staffing, and the expected timing of backlog conversion | Capital requirements materially above the asset-intensity assumptions used here would reduce the cash value of a given growth path |
| The following two to four quarters | Operating margins alongside the revenue impact of changes in estimates | Margins remaining close to current levels as estimate adjustments decline would strengthen the case for durable earnings; otherwise, the margin assumption should be reduced |
| The 2027 delivery cycle | Conversion of existing orders, net trade working capital, customer collections and new advances, considered together | Delivery of the order book with stable net funding requirements would provide stronger evidence of cash efficiency than continued growth in advances alone |
| Expansion at FIX and additional industry capacity in 2027 | Net property and equipment, revenue and capital expenditure in relation to one another; project gross margins and customer payment terms | Investment outpacing revenue while margins come under pressure would weaken the high-turnover assumption; the opposite would support a longer period of elevated growth |
These are conditions for reassessing the research, not company financial guidance or mechanical trading triggers. Public information is insufficient to assign reliable probabilities to the three scenarios. We did not obtain comparable project-level unit costs, cancellation compensation, factory utilization or current customer concentration in the public materials reviewed. A single conditional value should therefore not be presented as a definitive target.
FIX has demonstrated its ability to earn strong project margins during this construction cycle. The share price requires further delivery: a larger business must sustain high margins and retain cash after funding facilities, people and project execution. Subsequent changes in order delivery, margins and capital investment will determine whether these capabilities endure.
Valuation conventions, reproducible calculations and limitations
The reference enterprise-to-equity value bridge adds $2.1580bn of cash and $65.8m of short-term Treasury bills, then deducts $49.6m of interest-bearing debt and $50.8m for the fair value of existing contingent acquisition consideration. Undrawn credit facilities are not cash, and contract liabilities do not automatically constitute an equivalent amount of financial debt. Operating lease expense remains in operating profit; the same lease obligations are not deducted again as financial debt.[18]
The per-share denominator uses third-quarter weighted-average diluted shares of 35.152m as a proxy, rather than the maximum potential dilution from all future awards. Actual common shares outstanding on 2026-10-16 were 34.986m. Share-based compensation remains an expense and is not added back to cash flow. Increasing the reference-case denominator by 5%, in isolation, reduces the conditional value to approximately $1,018. This illustrates additional dilution pressure and does not correspond to an announced issuance plan. The model assumes no separate share repurchases to offset dilution. Existing acquisition consideration is deducted once in the equity bridge; the same balance is not deducted again from future cash flow.
Amortization of existing intangible assets follows the disclosed schedule. The amount disclosed for periods after 2030, without an annual breakdown, is allocated evenly from 2031 through 2035 in the model and falls to zero thereafter. This allocation is a scheduling assumption. Future acquisitions and their revenue are excluded from the organic growth model, and acquisition-related amortization is not added back indefinitely. The ratios linking net property and equipment and trade working capital to revenue growth are included in the reproducible calculations. Trade working capital uses a narrow, verifiable definition. Other operating balances remain unchanged in the reference and high-profitability cases, while the slower-growth case includes additional settlement pressure.
Varying the reference-case required return from 9% to 11% produces per-share values of approximately $1,252 to $932. Varying perpetual growth from 2% to 4% produces approximately $997 to $1,165. Varying the normalized tax rate from 23% to 27% produces approximately $1,098 to $1,040. These single-variable effects cannot simply be added together. A simultaneous deterioration in demand, margins and capital turnover requires recalculation under a complete combined scenario.
Readers can download the calculation model, underlying financial series and assumption tables. Financial facts come from original filings; charts and valuations are calculations for this article. Company materials and their SEC copies do not constitute two independent sources. Census and BLS data provide independent industry context. This research did not include management interviews, expert interviews or site visits. Unverified earnings-call transcripts, project cancellation probabilities and sell-side consensus estimates have not been presented as facts.
Sources and disclosures
[1] Nasdaq, FIX daily historical prices, 2026-10-22 row, accessed 2026-10-23; historical prices. Comfort Systems, 2026Q3 Form 10-Q, filed 2026-10-22; the EDGAR index records acceptance at 16:12:01 Eastern Time; the earnings 8-K index records 16:10:19. The Q3 earnings release gives the call schedule. Prices and filings [A]; comparison of dates [C]. ↩
[2] U.S. Census Bureau, 2026-08 private construction spending table, p.1, Data center row, released 2026-10-01; definitions of Construction and Value Put in Place. The monthly table is updated; this article uses the archived August edition. Amounts are seasonally adjusted annual rates and the initial August estimate. [A] ↩
[3] Comfort Systems, 2025 Form 10-K, published 2026-02-19, Note 3, Revenue by Type of Customer table; 2026Q3 10-Q, Note 3. TTM = full-year 2025 + first nine months of 2026 − first nine months of 2025; reported figures [A], period construction [C]. ↩
[4] 2026Q3 10-Q, Note 3, p.11, Revenue by Customer Type and Revenue by Activity Type. The ratio of incremental technology revenue to total incremental revenue and year-over-year growth in non-technology revenue are calculations for this article. [A] and [C] ↩
[5] 2026Q3 10-Q, MD&A Revenue, pp.24–28, explanation of same-store and acquisition growth; the same-store definition is given in that section. [A] ↩
[6] North Carolina Department of Commerce, EAS Asheboro expansion and JDIG announcement, 2025-11-25; EAS, The Evolution of EAS, 2026-10-05, Asheboro section. The government document establishes the project plans and incentive conditions; the interview provides management's account of execution. Plant-level returns were not independently verified. [A] ↩
[7] Comfort Systems, 2023 Form 10-K, 2024-02-22, and 2025 Form 10-K, Item 1, Human Capital Resources; 2026-08-03 investor materials, Slide 3. BLS, Electricians and Plumbers, Pipefitters, and Steamfitters, Training sections, updated 2026-08-27. [A] ↩
[8] EMCOR, 2026-07 corporate overview, pp.11 and 13; IES, Abilene facility announcement, 2026-05-19; FY2026Q3 earnings release, 2026-07-31, Infrastructure Solutions expansion section. [A] ↩
[9] FIX 2026Q2 10-Q, 2026-07-23, financial statements, pp.2–5; EMCOR 2026Q2 10-Q, 2026-07-30, pp.1–4 and segment table; IES FY2026Q3 10-Q, 2026-07-31, pp.6–10, less FY2026Q1 10-Q, 2026-01-30, pp.6–9. Reported figures [A]; period conversions and ratios [C]. ↩
[10] 2026Q3 10-Q, p.6, statement of cash flows; p.30, MD&A, Net Cash Used in Investing Activities. The outlook for 2027 capital expenditure is qualitative only. [A] ↩
[11] 2026Q3 10-Q, Note 3, p.12, Remaining Performance Obligations, and MD&A Backlog; 2025 Form 10-K, Item 1A, risk heading “Backlog is subject to unexpected adjustments and cancellations.” The range from 17.81×65% to 17.81×75% is calculated for this article; amounts are in billions of dollars. [A] and [C] ↩
[12] 2026Q3 10-Q, p.22, project-size table; EAS, Project Management at Scale, published 2026-06-17, updated 2026-06-25, paragraph beginning “Many of today’s builds”; 2025 10-K, Note 2, pp.52–53, customer concentration. Total contract value includes work already performed and is not equivalent to backlog. [A] and [C] ↩
[13] Figures 2 and 4 use the original 10-Qs from 2024Q1 through 2026Q3 and corresponding annual 10-Ks, financial statements and Revenue from Contracts with Customers notes. Complete quarterly URLs, filing dates and locators are included in the public calculation package. Quarterly differences and ratios [C]; reported figures [A]. ↩
[14] 2026Q3 10-Q, Note 3, pp.10–11, Changes in Estimates, and MD&A Gross Profit; the corresponding note in the 2026Q2 10-Q. Growth diagnostic = (9,897.290×93.4%)÷(6,455.574×95.4%)−1. Amounts are in millions of dollars; the percentages are rounded disclosures. [A] and [C] ↩
[15] 2026Q3 10-Q, p.6, statement of cash flows; p.29, FCF reconciliation. 2,047.172−1,019.179=1,027.993; the stress comparison deducting billings alone is 2,047.172−1,692.696=354.476. Amounts are in millions of dollars; both calculations are diagnostics rather than reported metrics. [A] and [C] ↩
[16] Comfort Systems, 2023-11-02 investor materials, p.9; 2024-11-01 investor materials, p.10, explanation of pre-bookings and equipment advances. [A] ↩
[17] Quarterly balance-sheet items: billed and unbilled receivables, costs and estimated earnings in excess of billings, inventories, accounts payable and billings in excess of costs and estimated earnings. The 2026Q3 balance is calculated as 3,837.245+184.114+159.328+120.921−945.969−3,872.012=−516.373 million dollars. This scope differs from the full CFO reconciliation. [A] and [C] ↩
[18] 2026Q3 10-Q, balance sheet and Notes 4, 6, 7 and 9. Short-term Treasury bills are included in Prepaid expenses and other and excluded from trade working capital. For uses of cash, see also the credit agreement, §§6.14 and 7.6; Texas Property Code Chapter 162, §§162.001 and 162.031, establishes obligations for certain construction payments. We did not obtain the legal attribution of group cash to individual contracts; no amount of restricted group cash is inferred from these provisions. [A] ↩
[19] 2026Q3 10-Q, p.6, cash uses; 2026 DEF 14A, 2026-04-09, pp.40–46, annual and long-term compensation; 2026-10-22 succession 8-K, Item 5.02. Cash repurchases and the disclosed total including excise tax have different measurement bases. [A] ↩
[20] Conditional calculations for this article; complete inputs, annual cash-flow schedules and formulas are in the public calculation package. Future growth, margins and their duration, capital intensity and terminal reinvestment, trade working capital ratios, retained cash, the 25% tax rate, 10% required return, 3% perpetual growth and exit multiples are assumptions. No scenario probabilities are assigned. Historical inputs come from the filings above; all were accessed on 2026-10-23. [C] ↩
This article is based on public information. Source dates, research assumptions and limitations are stated in the text. Review by professional investment or fund managers has not been confirmed. The publisher holds no investment-adviser licence. This article is not investment advice, an offer or a solicitation and is not tailored to any particular investor. Conditional calculations do not guarantee returns; past performance does not indicate future results.
Positions of the publisher and research participants in the subject or relevant counterparty securities: none; compensation related to this article: none; relevant business relationships or trading arrangements with the subject or its affiliates: none. Existing businesses include Expert Advisor trading software and VIP memberships, parameter presets and strategy source code, plus TopxAI AI-model API relay services and prepaid API credit cards. These businesses are unrelated to the research subject. This article is freely available and is not sold as a separate report. Material corrections will be dated at the top of the main-site article and reflected in its other published language or channel editions.