
Growth, inflation and the repricing of risk
20 October 2026 · Global macro research · Each observation carries its own cutoff.
The global economy is still expanding, but the investment case is becoming more conditional. Growth is uneven, renewed inflation limits the policy response, and equity leadership has narrowed. Our central judgment is a fragile expansion: enough economic and earnings support to resist a blanket recession call, but too much dependence on a small set of assumptions to treat a resilient index as proof of a resilient market.
The most consequential risk is a joint disappointment in earnings and discount rates. An energy shock can pressure household purchasing power while keeping interest rates elevated. An investment disappointment can weaken expected profits just as investors demand a higher return. Either channel matters; their interaction is where the larger drawdown risk lies.
This analysis brings together growth, inflation, financial conditions, earnings, market breadth and options pricing. We distinguish observed data from calculated proxies and conditional judgments. The result is a macro thesis, a set of testable market conditions and a clear account of what would change our view.
1. The global cycle: expansion with unequal beneficiaries
The IMF’s October forecast puts world real growth at 3.1% in 2026 and 3.4% in 2027, with headline inflation at 4.7% and 4.1%. Its country projections show substantial dispersion: the United States at 2.3% growth this year, the euro area at 1.1%, Japan at 0.7% and China at 4.5%. India’s 7.0% figure uses a fiscal-year convention. These are forecasts from one vintage, not synchronized observations of current activity. IMF October 2026 WEO, Table 1.1 and conventions
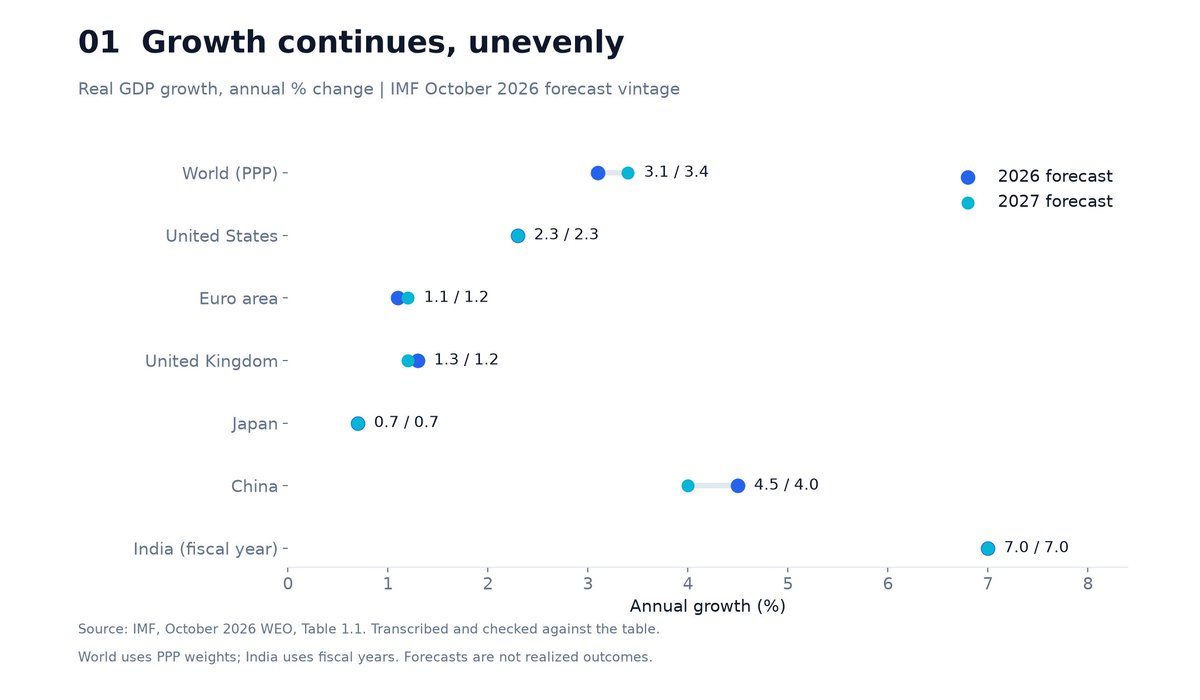
A common forecast vintage makes the cross-country comparison consistent. The IMF’s PDF states a September 30 statistical cutoff; its publication landing page describes information through October 1. Neither incorporates every release available on October 20.
For investors, the relevant question is which source of demand reaches a company’s revenues and cash flow. An exporter serving technology investment can face different conditions from a domestic retailer or a property developer in the same economy. Country GDP growth alone is therefore a weak substitute for examining customers, financing requirements and margins.
There is also a distinction between a forecast of positive annual growth and protection against a market drawdown. A positive full-year number can coexist with a weak quarter, a sector recession or an abrupt change in the price investors pay for future earnings. Conversely, falling equity breadth does not establish that global output is contracting.
2. The United States: weak hiring does not remove the inflation constraint
September headline CPI rose 3.7% from a year earlier and core CPI rose 2.6%. Monthly seasonally adjusted increases were 0.6% and 0.3%; gasoline accounted for more than half of the headline monthly increase. The distinction matters: an energy shock can raise headline inflation before a broad acceleration in underlying prices is established. BLS September CPI, released 14 October
Recalculating from the seasonally adjusted core CPI index gives a three-month annualized pace of 3.41% through September. That measure is more responsive, and noisier, than the year-over-year rate. It is also CPI, not the PCE measure used for the Federal Reserve’s inflation objective. One favorable twelve-month comparison would not by itself settle the near-term inflation question. FRED CPILFESL, BLS source
The labor side is softer. September payrolls initially rose by 29,000, while unemployment was 4.2%. The available July, August and September payroll changes average about 50,700 a month. Payroll and unemployment estimates come from different surveys and are subject to different uncertainties; these readings support a weak-hiring diagnosis, not a recession declaration based on one release. BLS September employment, released 2 October FRED PAYEMS, BLS source
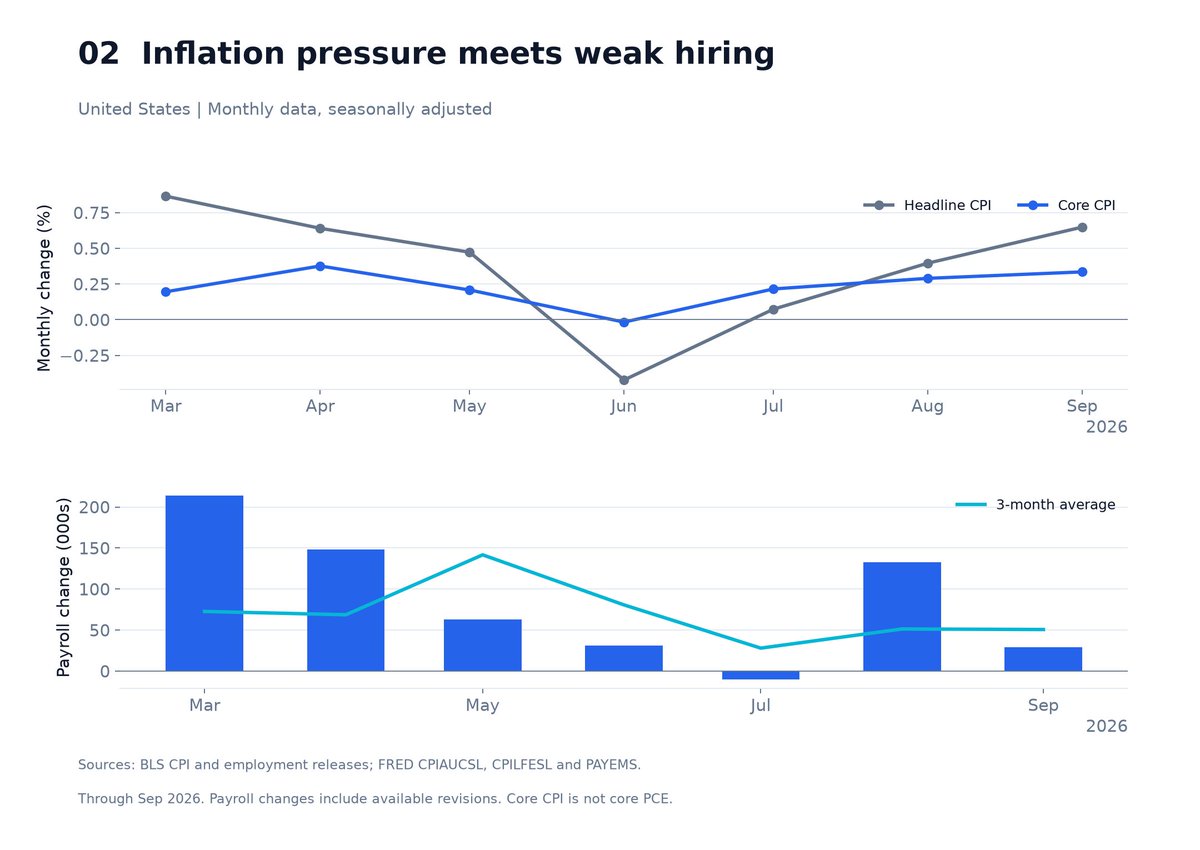
The original index levels reproduce the published rounded monthly CPI changes. The payroll average uses the latest available July and August revisions, not their initial headlines.
The policy response is already visible. The Fed raised its target range to 3.75–4.00% in September. The ECB also raised rates by 25 basis points that month, taking its deposit rate to 2.50%. Those decisions make an automatic easing narrative difficult to defend. The ECB’s September growth projection is a separate vintage from the IMF’s October forecast and should not be substituted into the same comparison without a label. FOMC decision, 16 September ECB decision, 10 September
Our inference is that policy relief is conditional on the composition of weakness. A demand shock that lowers inflation creates a different response from an energy shock that reduces real income while lifting prices. The latter is especially uncomfortable for assets whose valuations rely on both rapid earnings growth and falling discount rates.
3. China: aggregate growth and private investment tell different stories
China’s preliminary GDP estimate shows 4.6% real growth in the first nine months, including 4.5% in Q3. Over the same nine-month period, industrial value added for firms above designated size grew 5.3%, but consumer-goods retail sales rose only 1.1% in nominal terms. Fixed-asset investment fell 7.2%, private investment 10.4%, and property-development investment 20.6%, all nominal measures. China NBS, official English release, 19 October China NBS, Chinese statistical tables
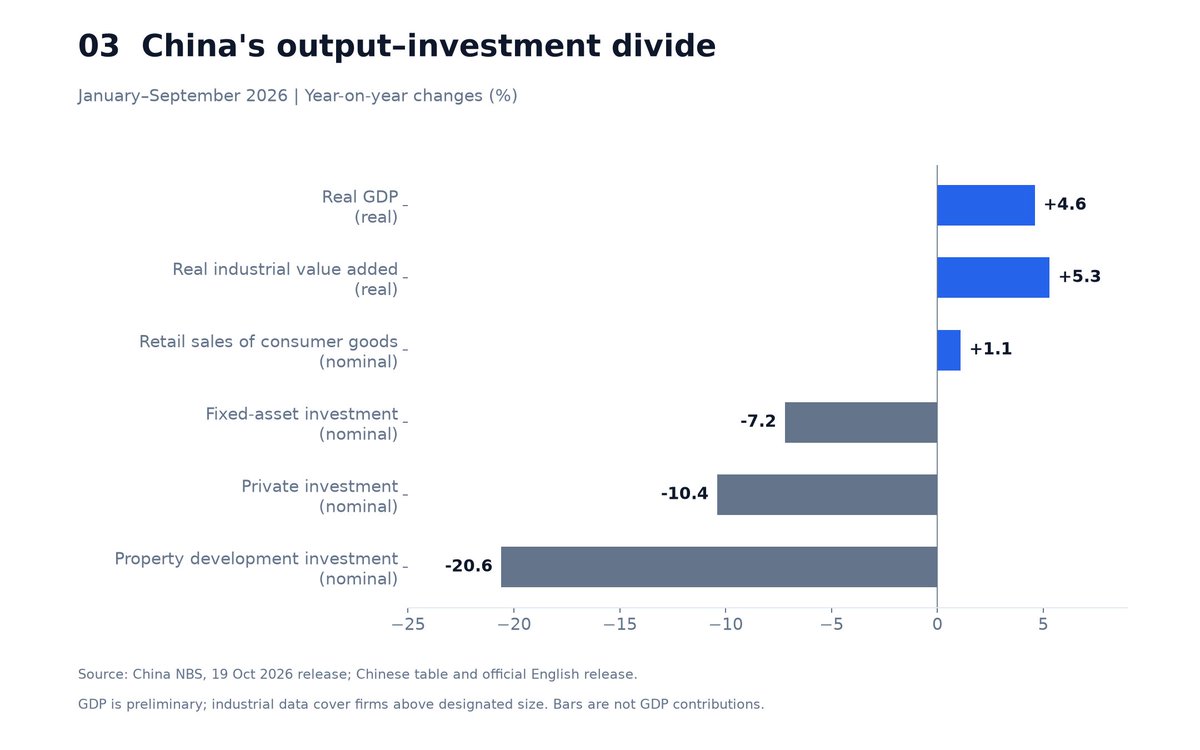
These series describe different parts of the economy and cannot be added as GDP contributions. Retail sales are not total household consumption; fixed-asset investment is not the national-accounts investment aggregate.
The defensible conclusion is a production–demand imbalance, with a substantial property and private-investment drag. It would be premature to describe the entire economy as contracting, or to assume that export and manufacturing strength automatically repair household and property-sector balance sheets.
A convincing improvement would show up in the transmission of activity into domestic spending and privately financed investment. That requires tracking household consumption, property transactions and cash collection, and investment outside state-led projects together. A higher aggregate growth print alone would not resolve the divergence shown here.
4. Rates and financial conditions: a high hurdle, without broad crisis confirmation
The latest common daily observations available in the retrieved Federal Reserve series are October 16: a 5.09% nominal ten-year Treasury yield and a 2.74% inflation-indexed yield. Their difference is 2.35 percentage points. That spread includes inflation compensation and market premia; it is not a clean forecast of future CPI. The H.15 release and FRED downloads agree on the quoted yield levels. Federal Reserve H.15, 19 October release FRED: US 10-year nominal yield FRED: US 10-year inflation-indexed yield
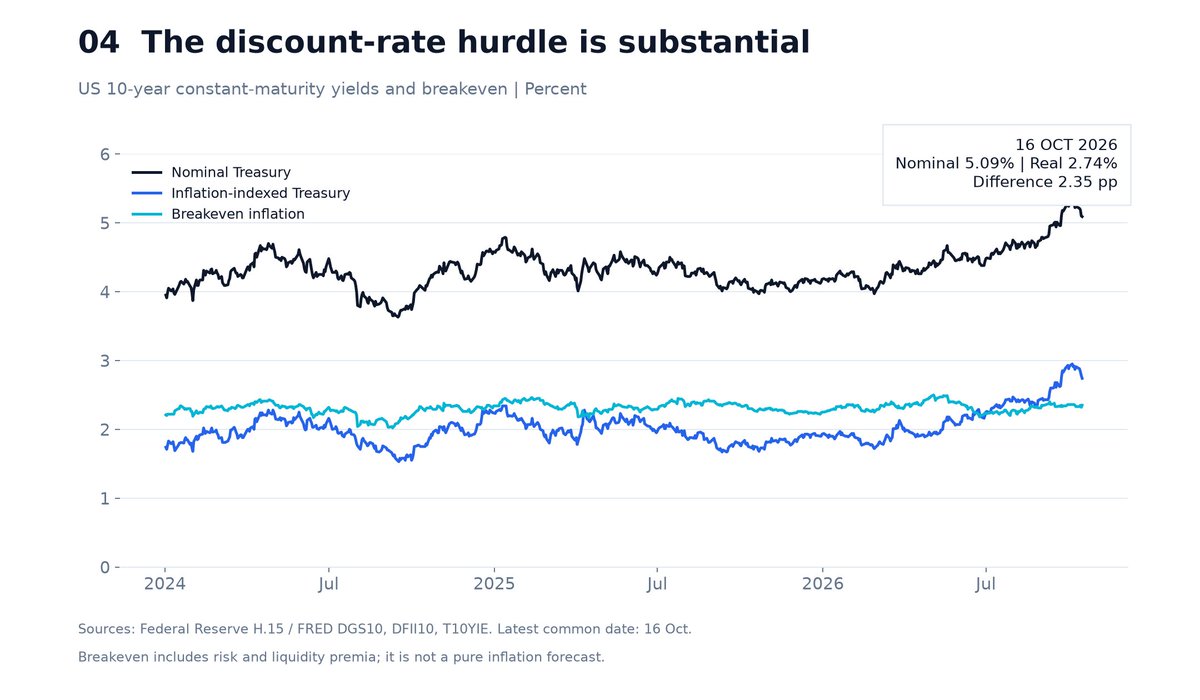
Constant-maturity closing observations are used consistently. Intraday bond-market headlines and later, partially populated dates are not spliced into this series.
A high real discount rate raises the hurdle for projects with distant cash flows. For a leveraged borrower, the pressure also depends on when debt matures, whether rates float and whether cash flows can absorb refinancing. There is no single date on which higher market yields transmit to the whole economy.
Fiscal support has a similar timing problem. It can sustain current demand while increasing future financing needs. Bond yields alone cannot tell us how much of a move reflects expected policy rates, inflation compensation or a term premium. We therefore do not attribute the entire yield level to fiscal deterioration or treat a yield-curve shape as a mechanical recession clock.
The available Chicago Fed NFCI reading is −0.499 for the week ending October 9, indicating looser conditions than its historical average. This provides a counterweight to a crisis narrative, but it is a lagging weekly composite whose history can be revised. It includes market variables, so it is not fully independent confirmation of equity-market conditions. Chicago Fed NFCI: data and methodology FRED NFCI observations
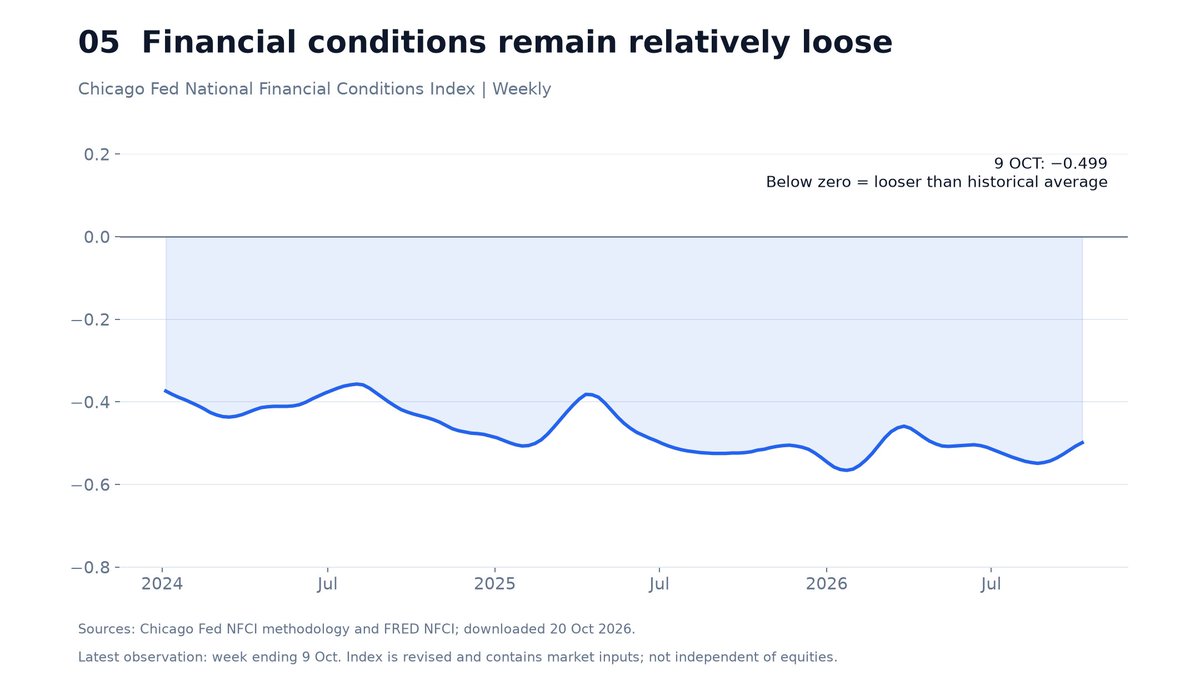
The financial-conditions cutoff is October 9, earlier than the equity and options cutoff. A benign older reading cannot rule out stress arising afterward.
Our conclusion is that vulnerability is visible before generalized funding distress is established. Credit spreads, refinancing access and money-market funding conditions remain essential confirmation channels. We have not established a complete real-time view of bank funding or private credit, so the claim is deliberately narrower than 'the financial system is safe.'
5. Equity breadth: the index is concealing meaningful divergence
Cboe’s September index review records a 0.45% decline in the S&P 500, a 5.0% decline in its S&P 500 Equal Weight index, a 5.4% decline in the Russell 2000 and a 5.2% gain in the Magnificent 10 index. That is substantial divergence. The index-level contrast indicates concentrated leadership; it does not count individual declining stocks. Cboe: Index Insights, September 2026
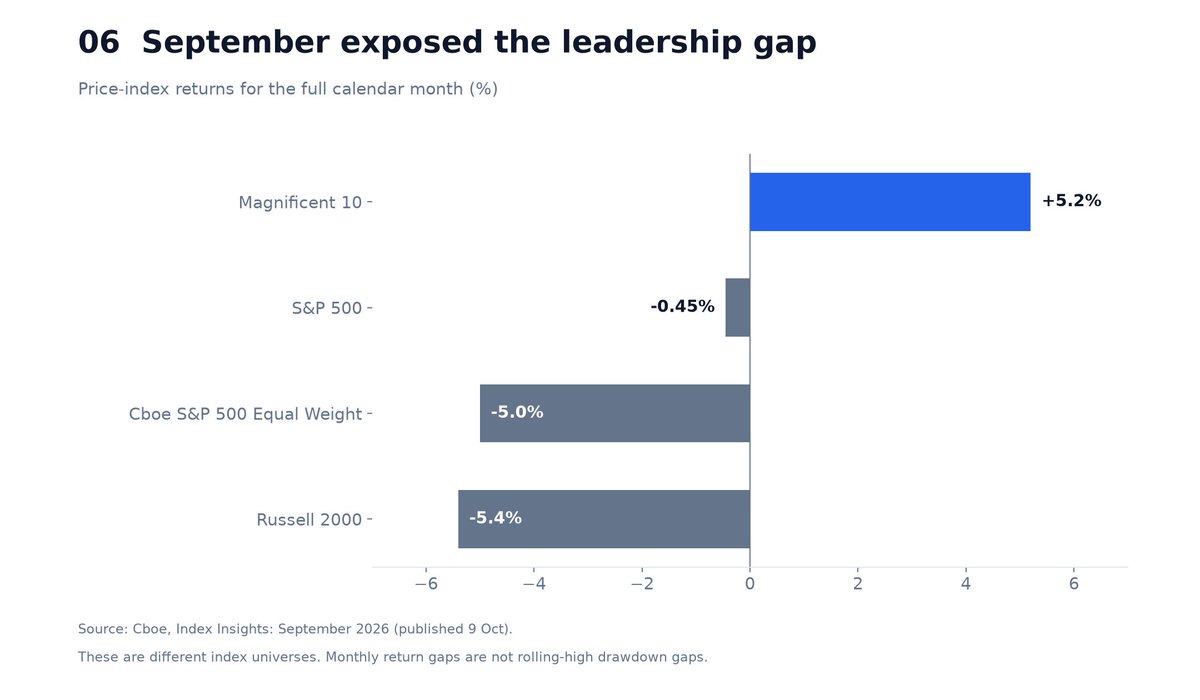
The capitalization-weighted versus equal-weight monthly return difference was 4.55 percentage points. It is not the same statistic as a gap in drawdowns from rolling highs.
A separate calculation using adjusted SPY and RSP closes provides a transparent proxy. For each ETF, we measure the percentage below its highest adjusted close over 252 sessions, then subtract SPY’s positive drawdown from RSP’s. On October 19 the gap is 2.23 percentage points: 3.85% below the rolling high for RSP versus 1.62% for SPY. Yahoo Finance: SPY daily history Yahoo Finance: RSP daily history
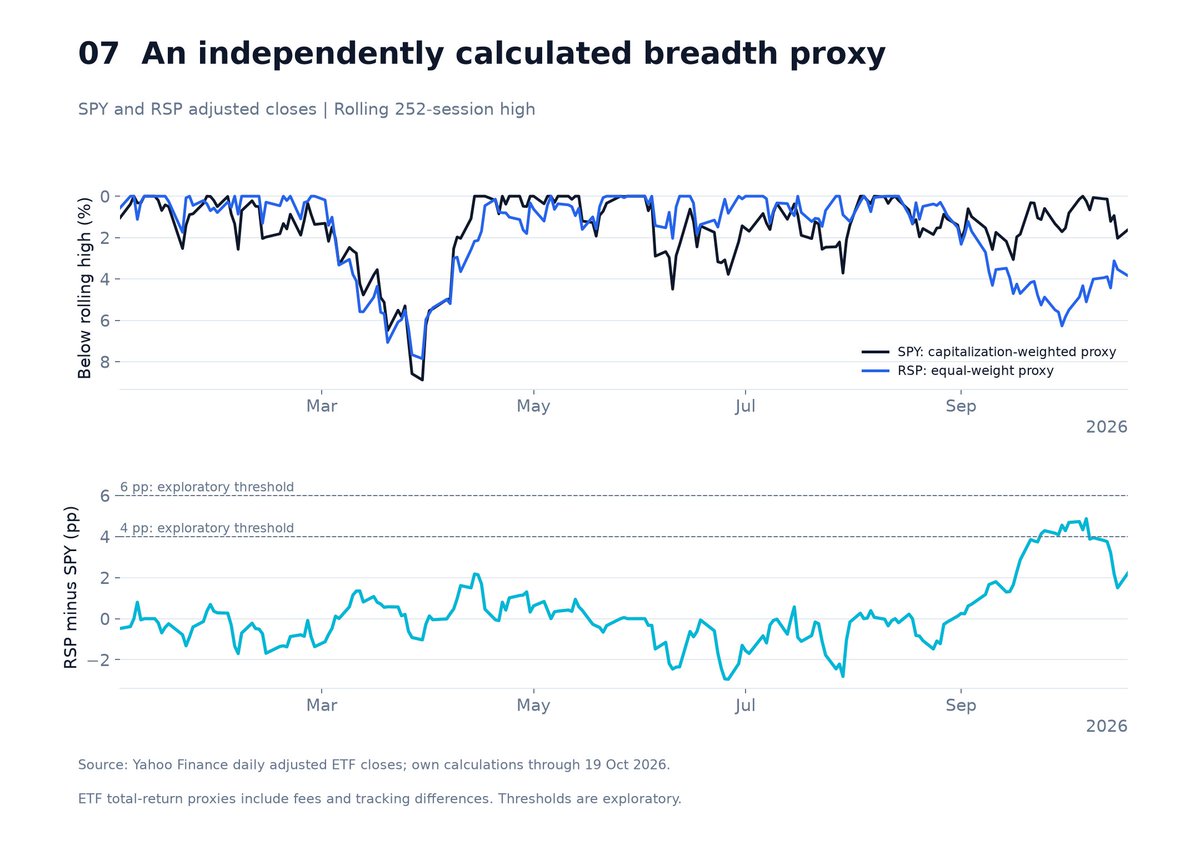
This ETF total-return proxy includes fund expenses and tracking differences. Its 252-session lookback is explicit; the four- and six-percentage-point thresholds below are exploratory comparisons, not validated trading triggers.
The economic meaning is reduced breadth of leadership, with a caveat: equal weighting also changes sector exposure, size exposure and rebalancing behavior. Underperformance therefore does not identify a single cause. Passive flows, earnings differences and sector rotation are hypotheses to examine, not conclusions recoverable from the two index lines.
Index volatility also depends on covariance. In the standard portfolio-variance identity, constituent variances are weighted alongside pairwise covariances. Large moves in different directions can coexist with subdued index volatility; a rise in correlation can then make diversification less effective. This mechanism is mathematically valid, but the charts do not prove deliberate volatility suppression or measure current dealer inventories.
6. Earnings and valuation: the strongest counterargument to a blanket bearish call
FactSet’s October 16 snapshot estimates 29.0% blended Q3 earnings growth. Excluding NVIDIA and Micron, growth is still 20.0%. The forward twelve-month P/E is 19.0, compared with five- and ten-year averages of 19.8 and 19.1. These figures do not support a simple claim that the whole index is trading at an unprecedented aggregate multiple. FactSet Earnings Insight, 16 October, pp. 1, 3, 7–8
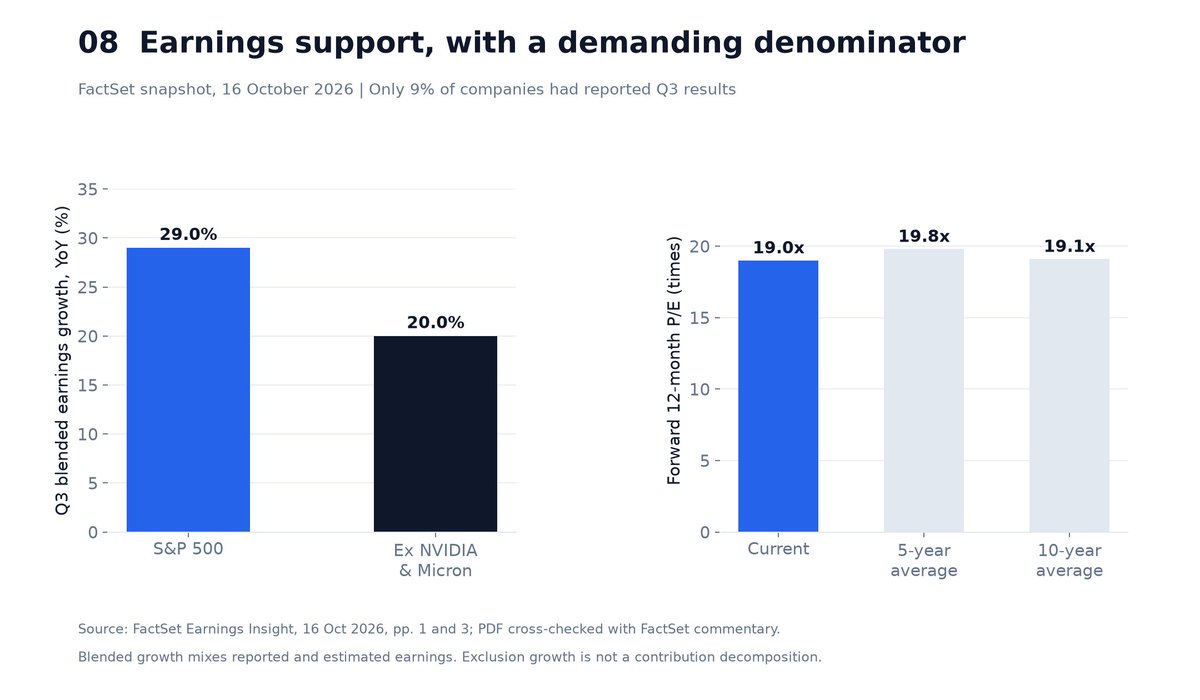
The important vulnerability is the durability of the earnings denominator. Only 9% of companies had reported, so blended growth remained largely forecast-dependent.
The early results are mixed in a specific way: 84% of reporters beat EPS estimates, but the aggregate surprise was 2.6%, below FactSet’s five-year average of 7.5%. Those historical averages cover full reporting seasons, so the comparison is descriptive, not a like-for-like verdict on this early sample. Base effects also inflate some growth comparisons. FactSet earnings commentary, 16 October
A reasonable multiple on optimistic earnings can still produce a poor outcome if the earnings are revised down. Equally, narrow price leadership can broaden if profits arrive outside the leaders. The data demand that both possibilities remain in the analysis.
For technology investment, the useful distinction is between capacity spending and the eventual return on that spending. Investors should examine revenue conversion, utilization, cash generation after capital expenditure and financing commitments. Those are tests for future company disclosures, not verified claims here that particular firms have already failed them. The IMF’s financial-stability analysis identifies AI-related concentration and leveraged amplification as risks, which supports monitoring these channels without supplying a date for a reversal. IMF October 2026 Global Financial Stability Report
7. SKEW: option-implied asymmetry and its limits
Cboe’s official series shows SKEW at 168.59 on October 16 and 161.86 on October 19. VIX closed at 19.99 and 18.44 on those dates. The two measures answer different questions: expected volatility and the asymmetry embedded in the option-implied return distribution need not move together. Cboe official SKEW history Cboe official VIX history
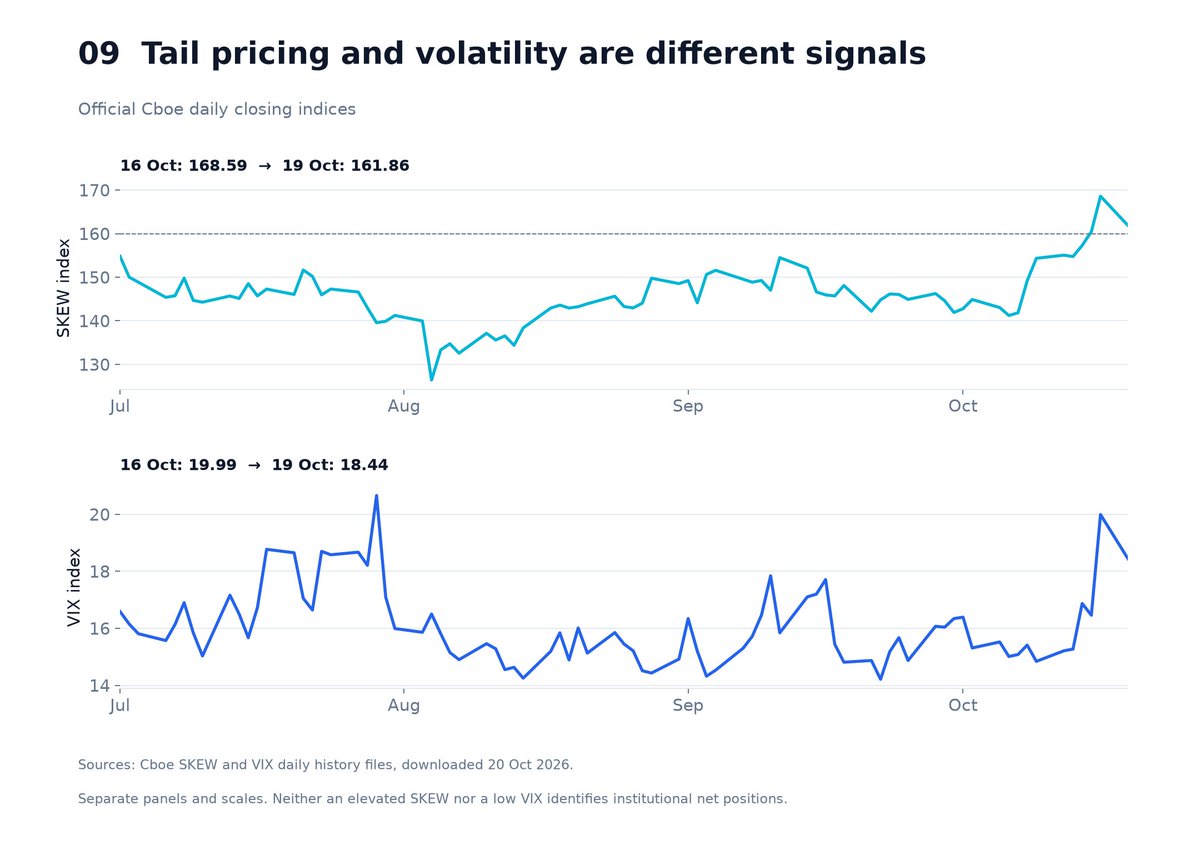
Pronounced option-implied downside asymmetry can coexist with modest expected overall volatility. A change in either index does not identify who initiated a trade or why.
The methodology linked by Cboe’s live dashboard defines SKEW using the risk-adjusted skewness of the thirty-day return distribution: SKEW = 100 − 10 × S. It is not simply an out-of-the-money put–call implied-volatility spread. Option-implied risk-neutral probabilities incorporate risk pricing and cannot be read as realized crash frequencies. Cboe SKEW methodology linked by the live dashboard Cboe SKEW dashboard
The rarity of a high SKEW reading depends on both the exact level and the sample window. Since 2021, 84 of 1,454 closes were at least 160: 5.78%. At or above 168.59, the share was 1.72%; at or above 170, it was 1.31%. Across the longer 1990-onward file, the ≥160 share was only 0.91%. The whole 160–170 range cannot receive one universal percentile label. Cboe official SKEW history
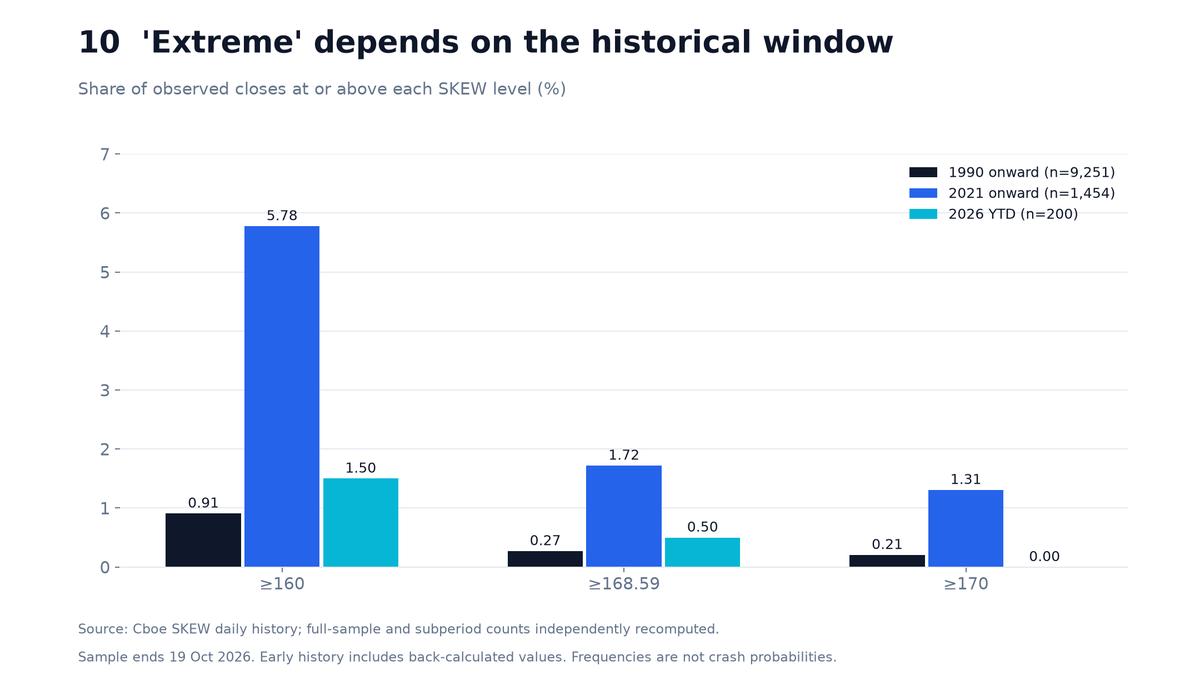
Threshold counts use every non-missing official daily observation through October 19. A historical upper-tail frequency measures rarity of the index level, not the probability of a subsequent stock-market crash.
SKEW does not identify the buyers, sellers or motives behind option trades. Establishing institutional activity or dealer exposure requires transaction-level evidence, participant identification and position estimates. Public index values alone cannot recover those facts.
8. Dealer hedging: a valid amplification mechanism with an unverified current sign
A short vanilla put has positive delta and negative gamma before hedging. If a dealer sells such a put and delta-hedges, the initial hedge normally involves selling the underlying. As the underlying falls, the position’s positive delta can increase, requiring more selling to remain hedged. That is a possible feedback mechanism; the negative direction of the hedge flow is not proof that the dealer’s entire book has negative net delta. Options Industry Council: Delta Options Industry Council: Gamma
The current aggregate effect depends on who owns the options, offsetting calls and puts, strikes, expiries, other products and existing hedges. Positive net gamma can instead produce stabilizing hedging. Estimated hedge flows and model-based gamma exposure are different quantities. The public data used here do not establish the current aggregate dealer position. Cboe’s earlier research is used for the mechanism only, not as a measurement of the 2026 book. Cboe research on dealer hedging mechanics (2023)
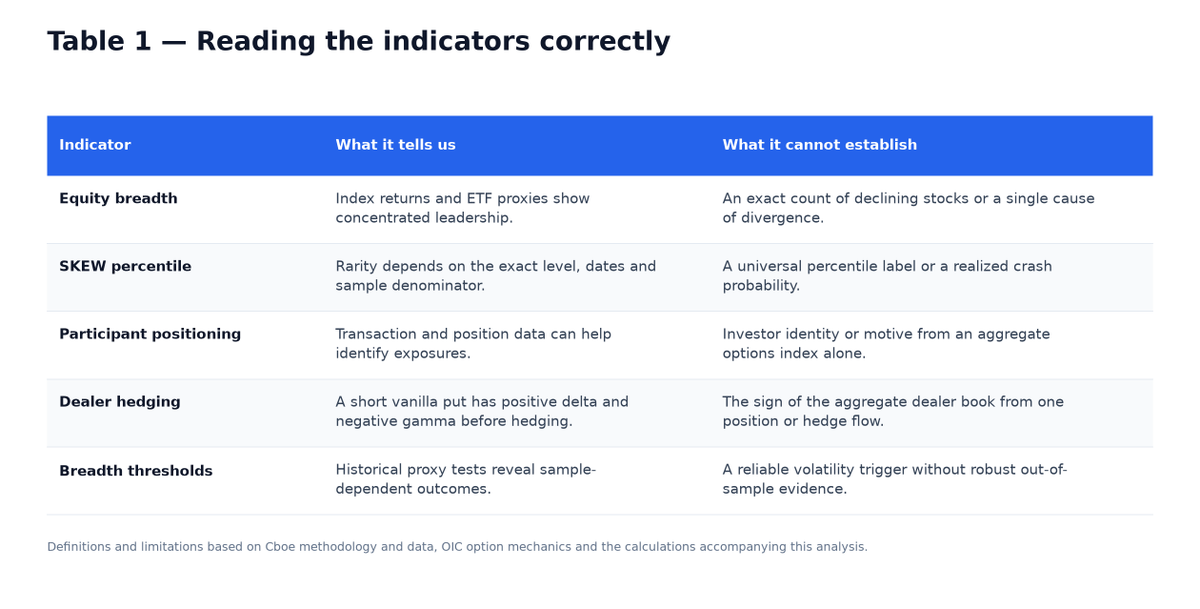
Definitions and limitations based on Cboe methodology and data, OIC option mechanics and the calculations accompanying this analysis.
9. Historical evidence and the limits of timing signals
We tested whether the public-data proxies justify strong timing language. For each eligible date, the outcome is the worst subsequent SPY adjusted close relative to the signal close over the next 21 common trading sessions. A loss event means that any of those closes was at least 5% lower. This is not peak-to-trough maximum drawdown, and it does not count intraday lows.
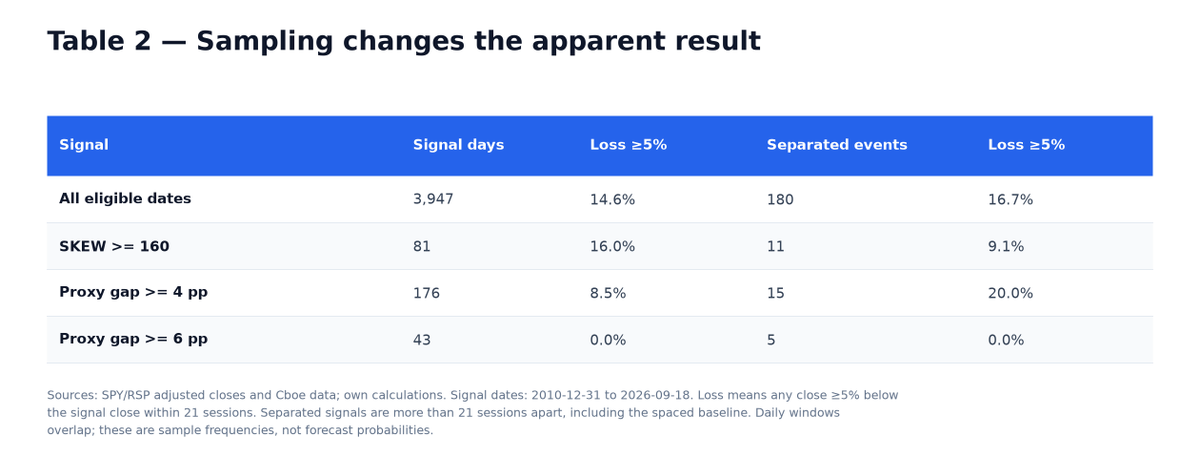
Sources: SPY/RSP adjusted closes and Cboe data; own calculations. Signal dates: 2010-12-31 to 2026-09-18. Loss means any close ≥5% below the signal close within 21 sessions. Separated signals are more than 21 sessions apart, including the spaced baseline. Daily windows overlap; these are sample frequencies, not forecast probabilities.
The eligible signal sample runs from 2010-12-31 through 2026-09-18; every observation has a complete forward window within the October 19 cutoff. The October high-SKEW episode is therefore not scored. At SKEW ≥160, 81 overlapping signal days reduce to just 11 separated events. Their loss frequencies differ materially. At a six-point breadth gap, the separated sample contains only five events; zero observed losses in five cases is not evidence of zero risk.
For subsequent volatility, the median maximum increase over the next 21 sessions was 2.09 index points after separated four-point-gap signals, versus 3.31 in the spaced all-date baseline. At a six-point gap it was 4.57, but across only five events. The mixed outcomes and small event counts do not establish a reliable four- or six-point volatility trigger.
This is an exploratory retrospective check, not an out-of-sample strategy test. The thresholds were selected for exploratory comparison rather than established in a preregistered design; observations cluster in particular regimes, the event-spacing rule is arbitrary, and the baseline is not matched for volatility or trend. We report the fragility of the evidence rather than attaching predictive probabilities or a trading rule to a small sample.
10. The scenarios that would change the investment conclusion
Our base case is continued, uneven expansion with selective risk taking. That judgment has moderate confidence: aggregate growth and earnings support it, while weak hiring, investment divergence and constrained monetary relief limit conviction. It should be revised as evidence changes, not defended by a single options indicator.
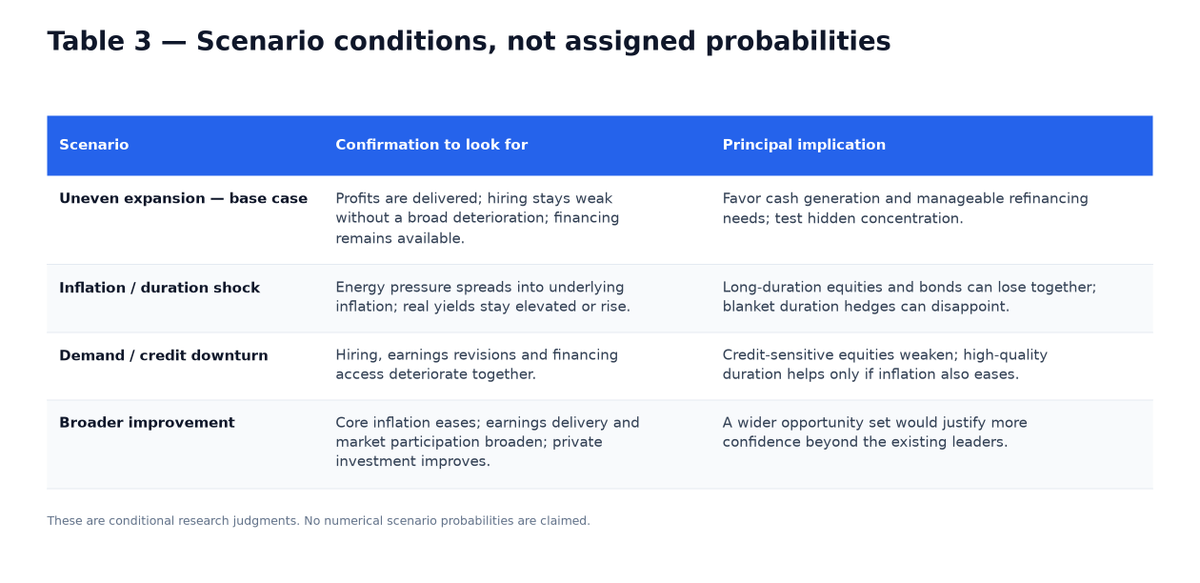
These are conditional research judgments. No numerical scenario probabilities are claimed.
The first adverse route is a discount-rate shock: higher inflation or a higher required real return reduces the present value of cash flows. The second is an earnings shock: weaker demand or disappointing investment returns reduces those cash flows. A correction becomes more dangerous if leverage, redemptions or hedging then force selling into reduced market liquidity. The feedback is plausible; its current magnitude has not been measured here.
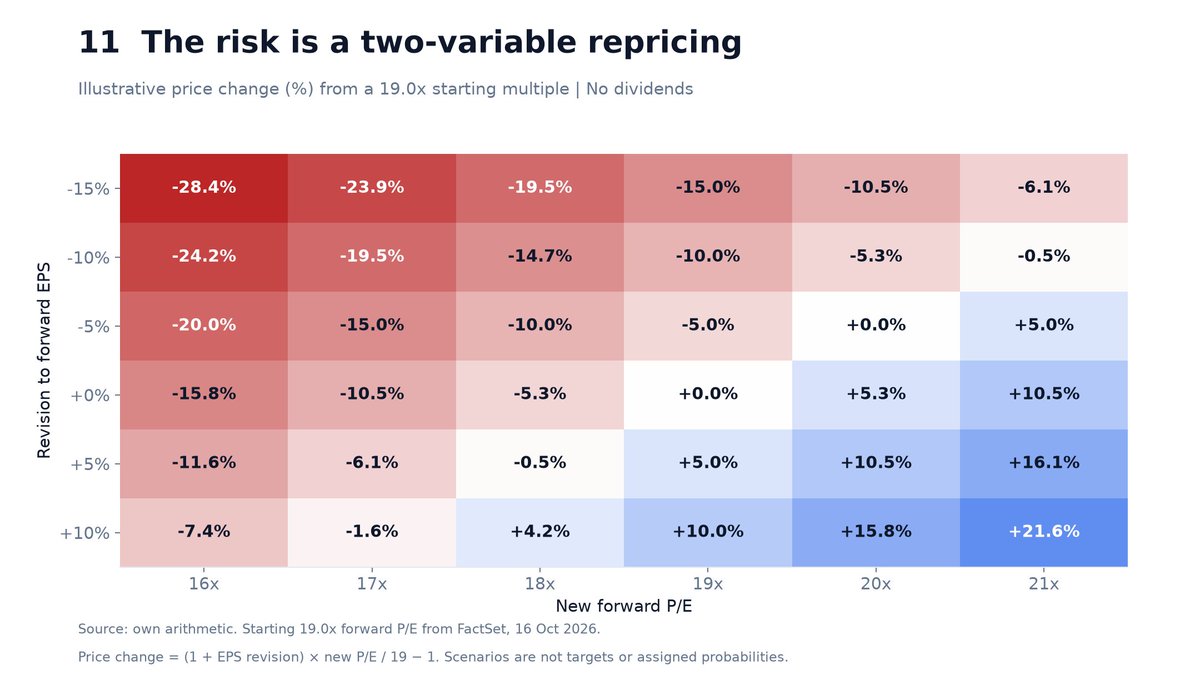
A 10% cut in forward EPS together with a move from 19x to 17x implies a 19.5% price decline before dividends. Unchanged EPS with a 20x multiple implies a 5.3% rise. These are arithmetic sensitivities, not index targets.
The matrix explains why 'the multiple is near average' and 'the market is vulnerable' can both be true. It also explains why a confident bearish call needs an earnings or discount-rate argument. Merely pointing to concentrated leadership does not establish the size or timing of the repricing.
11. Cross-asset implications and explicit conclusions
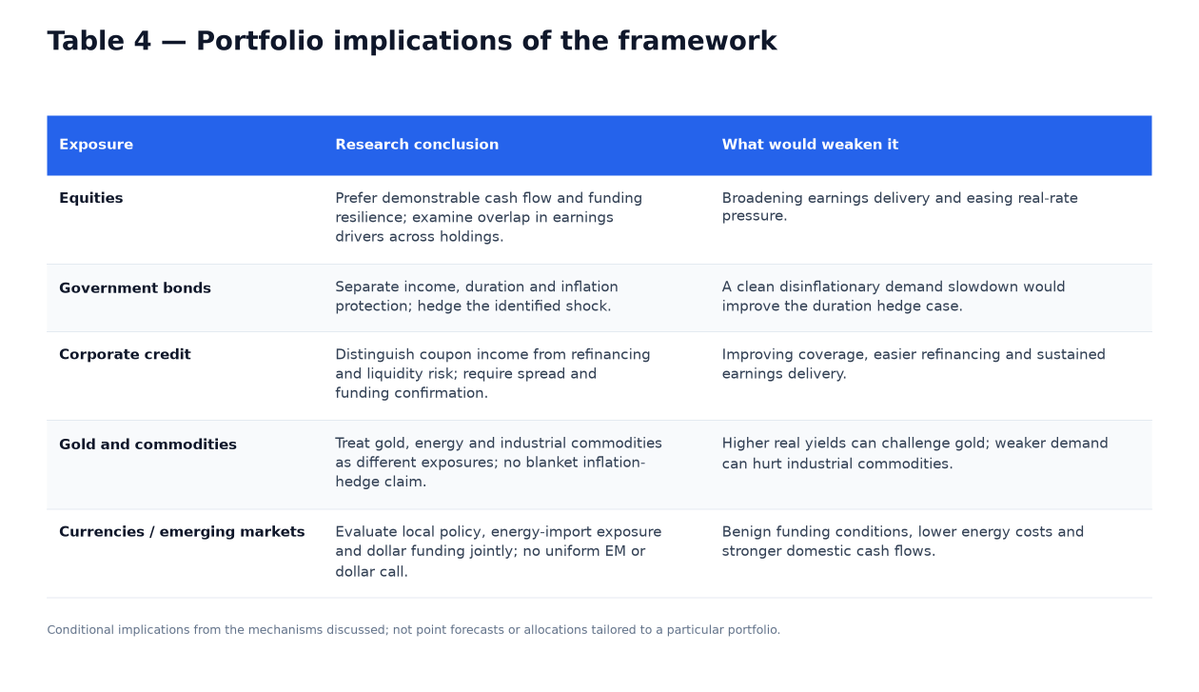
Conditional implications from the mechanisms discussed; not point forecasts or allocations tailored to a particular portfolio.
Five conclusions follow. First, the evidence supports an uneven expansion, with greater sensitivity to shocks; it does not establish a synchronized global recession. Second, inflation limits how confidently investors can rely on monetary easing after weak growth news. Third, narrow equity leadership is a real vulnerability, but earnings and valuation data provide meaningful resistance to an indiscriminate bearish thesis.
Fourth, elevated SKEW flags greater option-implied downside asymmetry, but does not identify institutional motives, aggregate dealer positioning or a reliable crash threshold. Fifth, the most useful warning would be convergence across earnings revisions, financing conditions and breadth. Several deteriorating channels would justify a larger change in risk exposure than one high SKEW reading.
The practical stance is to retain exposure to an expansion that still has support while reducing dependence on a single favorable path for earnings, rates and liquidity. Greater confidence would require broader profit delivery, easing underlying inflation and a repair in private demand. A more defensive stance would require evidence that market fragility is transmitting into financing and cash flows. Those are the conditions against which this thesis should be judged.
Originally published by TopxAI on X on 20 October 2026. Republished here with the original text, charts and source links.