Helios has an identifiable basis for development returns. Long leases, escalating rent and delivery of the first phase give Galaxy a foundation for expanding from digital finance into data centers. How much value reaches GLXY shareholders depends on when construction capital is invested, how debt is refinanced and whether the facilities generate income beyond their initial leases. Those conditions need to be considered together. Neither a high project margin nor the consolidated cash balance answers the question of value per share.
This analysis uses the October 21, 2026 closing price of $16.93, financial balances at June 30, 2026, and public information available through October 22, 2026 at 19:15:37 UTC. It was written on October 23. All per-share figures below are conditional calculations using those dates and stated assumptions. They are not live valuations, formal price targets or probability-weighted forecasts. Our research stance is Observation, with no directional rating.
Leases establish revenue; delivery and collection dates determine early cash
Galaxy leases Helios data center infrastructure to CoreWeave, developing the site, buildings and supporting electrical and mechanical systems. The tenant operates the GPUs and cloud services. The Phase II lease places electricity, taxes, insurance and general maintenance primarily with the tenant, while Galaxy retains mechanical, cooling and management staffing costs. That allocation supports high rental margins, which must still be assessed against construction and financing costs. The direct source is the July financing presentation, slide 9 and footnotes 6 to 7.
Signed leases across three phases cover 526MW of IT capacity. Phase I has been delivered, establishing an execution record. The later phases involve a larger construction program, with earnings dependent on delivery against budget and schedule.
| Project | IT capacity | Construction cost | Revenue and delivery basis |
|---|---|---|---|
| Phase I | 133MW | $1.8 billion | Average annual base-term revenue of $315 million; delivered in Q2 2026 |
| Phase II | 260MW | Estimated $4.0 billion | Average annual base-term revenue of $690 million; rent starts in Q2 2027, with the last hall planned for early 2028 |
| Phase III | 133MW | Complete budget not separately disclosed | Rent not separately disclosed; phased commencement planned for 2028 |
Sources: the Q2 2026 presentation, slide 16, and official earnings call, PDF pages 7 to 8, counting the cover. Average annual revenue includes escalation over the lease term and differs from cash collected in the first year.
Phase I illustrates the distinction between accounting revenue and cash rent. Galaxy expects approximately $80 million of quarterly straight-line rental revenue from the third quarter. Yet the Q2 Form 10-Q, Note 13, pages 32 to 33, discloses minimum cash rent of $259.1 million for 2027, 17.75% below the $315 million annual lease average. Interest and distributions require current cash, so valuation needs the collection schedule for each year.
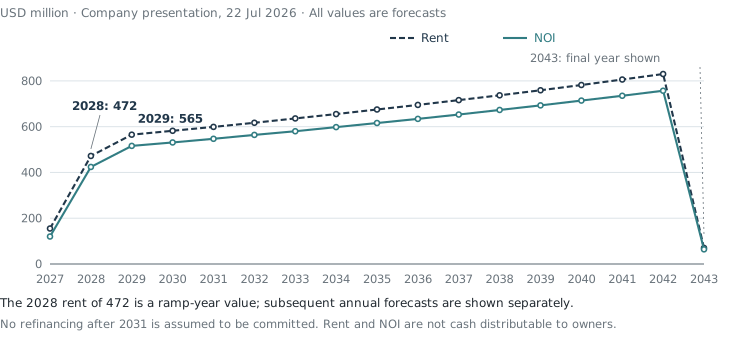
Phase II also has a substantial delivery ramp. Company projections show rent increasing from $472 million in 2028 to $565 million in 2029, when operations are closer to having all halls in service. Extending the 2028 figure as a long-term base would omit income from the remaining deliveries. Bringing a full-year revenue figure into the construction period would make the opposite error, overstating early funding coverage.
A roughly 12.5% initial yield on cost depends on both the budget and the lease
Applying the disclosed 13.7% initial annualized gross yield to the $4 billion construction budget produces a $548 million initial full-year rent proxy. Staffing costs of $15 per kW per month on 260MW of IT capacity imply approximately $46.8 million of annual expense. That leaves about $501 million of NOI, or a 12.5% net yield on cost. These are our calculations from public inputs, measuring development economics before financing and income tax. Annual valuation uses the company's full rent curve rather than replacing it with this rounded initial figure.
The result is modestly above Digital Realty's disclosed 11.5% expected stabilized cash yield on development projects. That comparison is useful, but Helios is concentrated in one campus and tenant, and the companies differ in cost scope, operating responsibility and development stage. The roughly one-percentage-point spread does not establish that execution and concentration risks are adequately compensated. Digital Realty's Q2 supplement, page 23 and footnotes 6 to 9, provides the comparison basis.
Cost changes can consume that spread quickly. With rent and staffing expense unchanged, total construction cost of approximately $4.358 billion reduces the net cost yield to 11.5%, an overrun of about 9%. If the debt facility is fixed, additional construction requires more equity, making equity returns more sensitive than project NOI alone suggests.
Treating every overrun as unrecoverable would also overlook the lease mechanism. The December 2025 investor day, slide 27, describes a yield-on-cost framework under which eligible construction expenditure may increase the rent base. In a normalized completed-asset comparison with a fifteen-year lease and no residual value, reference equity IRR is 14.70%. A 20% cost increase with unchanged rent reduces it to 4.43%; proportional rent adjustment produces 12.79%. Identifying eligible expenditure and the date of rent adjustment is therefore central to assessing an overrun.
These conditional IRRs assume 20-year tax depreciation, a 21% tax rate and 3% annual growth in rent and staffing costs, with maintenance investment and financing fees included. They are neither Galaxy's historical development returns nor returns directly available to Class A investors. Some contractual economic schedules are redacted, leaving the scope of cost recovery incomplete. The evidence supports development profit while leaving a material question about who bears specific incremental costs.
Amortization builds equity but limits early distributions
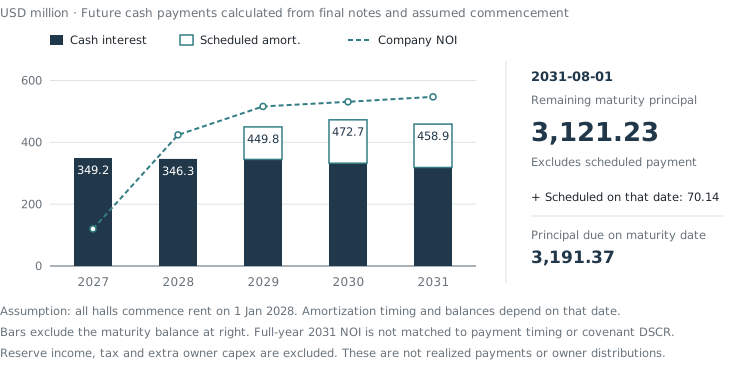
Phase II ultimately issued $3.507 billion of bonds at a 9.875% coupon, implying approximately $346 million of full-year interest. The final indenture also requires principal amortization after the relevant commencement conditions are satisfied. Assuming all halls have commenced and are paying rent in January 2028, company-projected 2029 NOI of $516 million leaves approximately $66.21 million after interest and scheduled principal. The comparable 2030 amount is approximately $58.26 million. Both precede tax and additional capital expenditure, and neither establishes compliance with every distribution condition. Financing terms are in the closing Form 8-K, Item 1.01, and indenture, Exhibit A and Sections 1.01 and 14.01.
Construction-period NOI below interest does not establish an equal, unfunded permanent shortfall. On the August call, PDF pages 7 and 12, management said Phase II debt and equity funding had been arranged and the required initial equity invested. Interest funding and reserves bridge the period before operations. Further financing needs depend on remaining construction, reserve usage and actual payments; the entire construction budget should not be counted again as future equity to raise.
Funding arranged at closing does not eliminate completion exposure. The same July 28 Form 8-K, Item 1.01, Completion Guarantee, states that Galaxy LP must supply additional funds without a monetary cap if bond proceeds and available funds, including earlier equity contributions, cannot bring the required phases to rent commencement. An unrecoverable construction overrun can therefore reach LP capital even though the project has its own borrower. This is completion support, not a guarantee of every operating-period obligation.
Principal repayment also has economic value. Holding asset value constant, less debt means more net equity, so low cash distributions do not imply that all returns disappear. Investors must assess whether the equity accumulated later compensates for development risk and can be realized or refinanced at an acceptable cost.
The bonds mature in August 2031, before the base leases expire. Under the stated cash-calendar assumptions, approximately $3.191 billion requires refinancing, including scheduled principal due on the maturity date. Using the company's $564 million NOI forecast for 2032 in the financing presentation, slide 27, financing structure materially changes the equity required.
| Refinancing rate | Interest-only debt capacity | Twelve-year level-payment capacity | Equity required under the twelve-year structure |
|---|---|---|---|
| 6.5% | $6.198 billion | $3.287 billion | $0 |
| 8.5% | $4.739 billion | $2.959 billion | $233 million |
| 10.5% | $3.837 billion | $2.679 billion | $512 million |
Our calculations assume 1.4-times coverage throughout and do not yet impose loan-to-value limits or financing fees. At 8.5%, an interest-only structure passes this coverage test, while twelve-year level principal-and-interest payments require additional equity. Alongside interest rates, the amortization period lenders accept determines the burden on common shareholders.
Tenant credit and power capacity must translate into cash obligations
CoreWeave's contract structure supports rent quality while introducing concentration. Approximately 98% of its revenue comes from committed take-or-pay contracts; its three largest customers represented 36%, 26% and 10% of Q2 2026 revenue. Lower short-term GPU utilization need not immediately reduce contractual revenue. Delivery acceptance, prepayments and credit changes among a few customers have more direct implications for collections and capital planning. See CoreWeave's Q2 Form 10-Q, Note 2 and risk factors.
Continued access to financing is positive evidence that belongs in this assessment. CoreWeave had $5.524 billion of cash at June-end and $10.014 billion available under existing facilities, subject to draw conditions. Its September convertible issue added resources: $4.2 billion of principal produced $4.137 billion after underwriting discounts, or approximately $3.571 billion after capped-call expenditure and before other issuance costs. The September 22 Form 8-K, Item 1.01, contains the terms. These resources improve its financing position but must be assessed alongside construction payments and maturities over the same period.
NVIDIA's purchase arrangement for unsold cloud capacity provides support subject to delivery, availability and termination conditions. It does not thereby become a direct guarantee of Galaxy's rent. The relevant Form 8-K, Item 1.01, defines that arrangement. If tenant collections break down, the landlord still faces interest, preservation and reletting costs. Our conditional Phase II test assumes interruption in year six, one year of vacancy, $200 million of conversion expenditure and replacement rent at 80% of schedule. At a 10% discount rate, equity NPV falls by approximately $811 million relative to normal performance. This measures loss severity without assigning a default probability.
Expansion also requires fresh capital. Another 830MW of gross Helios power capacity remains unleased. Scaling the Phase II relationship of $4 billion of construction to 400MW of gross power implies approximately $8.3 billion of investment. Debt covering 65% to 85% of construction still leaves approximately $2.905 billion to $1.245 billion of equity. This illustrates funding scale, excludes possible reserves and fees beyond the assumed budget, and assigns no value to unsigned capacity.
The company's September 8 project update places projects in conditional Base or Studied classifications. Gross power, IT capacity, capacity awaiting allocation and signed leases are different measures. Progress on electricity access still needs tenants, construction and financing. Shareholder value depends on the rental return earned by each increment of equity capital, not the total MW listed in a development pipeline.
Regulatory progress also affects timing. ERCOT board materials, pages 3 to 4, describe the August pause in relevant final classifications and energization approvals for unconnected large data centers; September classifications remained subject to verification. The state environmental directive, pages 1 to 2, added permit-timing uncertainty. A report scheduled for December 10 is a review milestone, not automatic approval or energization for every project. Operating assets, construction projects and unsigned development resources require assessment at their respective stages.
Digital finance needs better returns in ordinary quarters
Galaxy's financial businesses include execution, lending, structured products, investment banking, asset management and validation services. Trading and finance require inventory, margin and lending capital; management and validation depend more on fee-generating scale. Q2 digital asset sales of $8.483 billion came with $8.440 billion of sales costs. Adjusted gross profit after trading costs and relevant adjustments is more informative than gross sales for assessing shareholder returns. Business and profit definitions appear in the Q2 Form 10-Q, MD&A pages 59 and 62, and Financial Supplement, slide 4.
Digital Assets generated approximately $247 million of adjusted EBITDA in 2025, slightly less than the approximately $250 million contributed in the third quarter alone. That quarter included an 80,000 BTC execution and other financing and trading income. It demonstrates the ability to handle complex client business, but public disclosures do not allocate profit to each transaction or establish a recurring annual earnings base. The 2025 annual report, MD&A pages 96 to 97, and Q3 Form 10-Q, pages 64 to 66, provide the context.
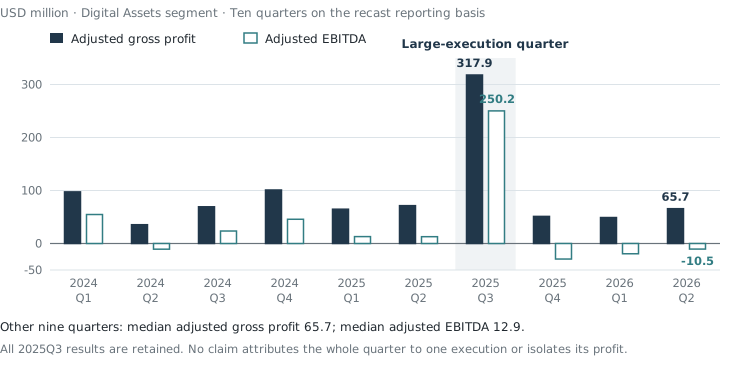
Across the other nine quarters, average adjusted gross profit was approximately $67.24 million. Including stock-based compensation and depreciation, adjusted quarterly costs averaged approximately $84.81 million in the first half of 2026 and reached $87.10 million in Q2. The nine-quarter sample does not guarantee future normal earnings, but it shows that ordinary-quarter revenue has not consistently absorbed the larger cost base. If growth requires more expenses, lending and investment, the cash available to Helios will be lower than headline earnings suggest.
June-end Digital Assets net capital was approximately $964.4 million. At the existing average cost base and an illustrative 21% tax rate, a 10% after-tax capital return requires approximately $115.3 million of quarterly adjusted gross profit; 12% requires about $121.4 million. Neither includes corporate overhead. These return requirements are research parameters, not verified company costs of capital. Lending also illustrates the difference between scale and pricing: Q2 average loans grew roughly 30% year over year while lending revenue fell about 11%. An annualized gross-yield proxy based on revenue divided by average loans declined from about 10.1% to 6.9%. More lending alone does not ensure better capital returns.
Growth consumes cash as well. The first-half cash-flow statement, pages 14 to 15, shows that loan originations less collections produced approximately $435 million of net cash outflow; investment purchases less proceeds used approximately $41.09 million. Earnings become available for construction only after funding additional business capital. During a digital asset downturn, financial fees, Treasury realizable value and equity financing conditions may deteriorate together. This is a central way risk travels between the two businesses on the same balance sheet.
Available funding and economic ownership determine the per-share result
Known near-term uses include $445 million of exchangeable notes maturing on December 15, 2026. The initial conversion price of approximately $33.34 is above our reference share price, so the exchange feature does not assure conversion will settle the obligation. Galaxy also has stablecoins, investments and an equity issuance program. A single consolidated cash figure cannot establish a funding gap.
| June-end resources and known uses | USD million | Interpretation |
|---|---|---|
| Consolidated cash | 895.744 | Includes project subsidiaries and client-related funds |
| Data center cash set aside | -228.021 | Conservative reservation, not proof of account-by-account restriction |
| Client and collateral cash liabilities reserved | -195.251 | Avoids treating repayable funds as debt-service resources |
| Cash-screen proxy | 472.472 | Not standalone parent-company free cash |
| Disclosed August repurchases, December principal and second-half coupons | -485.356 | Contractual uses and repurchases already made |
| Difference before other resources and subsequent flows | -12.884 | Not a forecast financing shortfall |
Calculated from the Q2 Form 10-Q, balance sheet and Notes 10, 16 and 24, and Financial Supplement, slides 7 and 9. Reservations may overlap; public disclosures do not provide a complete account-level schedule of funding uses.
Gross stablecoins were $1.563 billion at June-end, but the owned, unpledged and transferable portion is not fully identified. About 0.83% of the gross balance would cover this screening difference. Treasury also had approximately $553 million of token and other liquid-investment exposure. Calling $12.88 million a financing gap would therefore imply precision the evidence does not support. Treating all stablecoins or investment carrying values as available cash would instead ignore ownership, exit costs and usage restrictions.
Completed Phase II funding is consistent with a transfer from June-end corporate cash into July project accounts. That transfer reduces parent liquidity without reducing group assets. If project valuation already deducts all remaining construction, the internal transfer should not reduce value again. Phase III debt, unrecoverable overruns and tax distributions remain relevant funding questions. The May ATM arrangement permits up to $500 million of gross issuance, but capacity is not cash received. Execution price determines the additional economic units.
The Up-C structure adds an ownership distinction. LP operating value belongs jointly to Class A shareholders and external LP unitholders. Inc.-specific net tax benefits and Tax Receivable Agreement, or TRA, obligations are then allocated to Class A. Our operating-value denominator uses the disclosed August 7 counts of 194.292392 million Class A shares and 196.596698 million external LP units. An existing LP unit exchanged one-for-one into Class A changes the ownership layer; a new issue to outside investors increases total economic units. Repurchases, conversion terms and share-count dates require separate adjustments.
The approximately $236 million June-end difference between Inc. and LP equity includes tax items and internal eliminations and is not automatically distributable. A separate $587 million accounting residual includes approximately $351 million of historical noncontrolling-interest allocation. See the Q2 Form 10-Q, Notes 17, 19 and 23, together with the supplement. The valuation effects differ: $100 million of LP value adds approximately $0.256 per economic unit; the same Inc.-specific net value adds approximately $0.515 per Class A share.
Deferred QOZ gains may also require tax distributions. We estimate 2026 taxable gains using disclosed QOZ investments and a 90% recognition ratio. This remains a tax-basis proxy; 90% is not a tax rate. Distributions from LP to Inc. move within the group, while distributions to outside LP holders and Inc. net tax or TRA payments have different cash consequences. Existing provisions, usable tax assets and realized offsets need to be reconciled to avoid deducting both the full LP distribution and all Inc. tax. Our reference case sets additional Inc. net value to zero without treating zero as a verified tax outcome. Another $100 million of unrecognized net tax would reduce conditional Class A value by approximately $0.515. The 2025 annual report, Note 18, and LP agreement, Section 5.03, describe the gains and distribution arrangements.
Two valuation methods expose the importance of asset life
The first method values remaining cash flows from signed projects with zero residual value at lease expiry. The second capitalizes stabilized 2029 NOI across the three phases at 6.5%, allowing continued use beyond the initial leases. Both use the same construction, ownership and operating inputs. Their principal difference is longer-term asset value. The zero-residual method still uses proxies for Phase III economics, Phase I tail-rent allocation and tax bases, so it is neither a liquidation floor nor a contractually guaranteed value.
| Value component | Remaining leases, zero residual | Stabilized asset capitalization |
|---|---|---|
| Non-data-center book capital proxy | 1,488.131 | 1,488.131 |
| Digital Assets revaluation versus book value | -289.312 | -289.312 |
| Present value of corporate costs and net fee adjustment | -776.576 | -776.576 |
| Issuance costs, interim financing costs and repurchases | -205.540 | -205.540 |
| Data center development equity after construction and net debt | 1,734.708 | 7,555.967 |
| LP economic value | 1,951.411 | 7,772.670 |
| Conditional value per Class A share, USD | 4.99 | 19.88 |
Amounts are USD millions except per-share values. All results are our calculations: 9% discount rate, 21% normalized tax rate, 20-year tax depreciation and maintenance investment equal to 1% of rent. Annual corporate expense is assumed to improve to $120 million, Digital Assets earns a 10% after-tax capital return, and additional Inc. net value is zero. Combined 2029 NOI is approximately $1.008 billion, including research proxies for Phase III. Unsigned power capacity receives no additional value.
The large difference comes primarily from treatment of the facilities after the base leases. Approximately 87.7% of gross operating present value in the reference capitalization method comes from terminal asset value. Within the project value implied by $16.93, the conditional present value of remaining lease cash flows after 2029 explains only approximately 56.1%. The other 43.9% requires post-lease facility value, reletting or a lower long-term discount rate. The upper calculation's dependence on those conditions prevents treating $19.88 as a price target.
Expenses matter too. Keeping corporate costs at the actual first-half annualized level of approximately $162.5 million produces conditional values of $4.30 and $19.20. The reference cost improvement is 26.16%; assuming it begins immediately and persists adds approximately $0.69 per economic unit. That benefit still needs to be earned. Holding the capitalization rate fixed means tax-rate changes primarily affect interim cash, not that long-term tax policy is irrelevant to asset pricing.
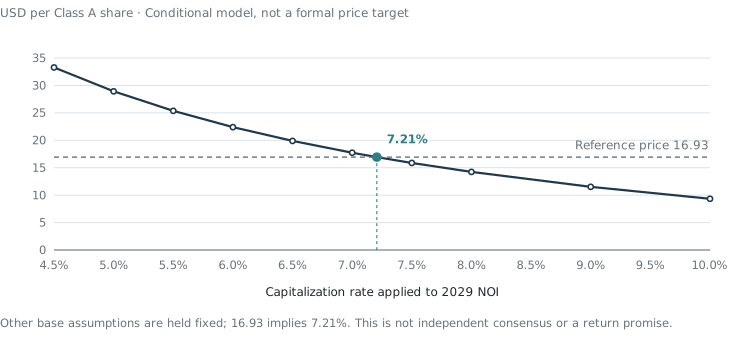
Under reference operating assumptions, $16.93 implies an approximately 7.21% capitalization rate on 2029 NOI. Keeping corporate costs at the actual annualized level lowers the implied rate to approximately 7.03%. If investors demand a higher capitalization rate, Digital Assets must contribute more earnings to support the same share price.
| Capitalization rate on 2029 NOI | Required Digital Assets after-tax capital return | Required quarterly adjusted gross profit |
|---|---|---|
| 7.0% | 6.75% | $105.4 million |
| 7.5% | 14.31% | $128.5 million |
| 8.0% | 20.93% | $148.7 million |
These reverse calculations retain $120 million of annual corporate costs and value continuing Digital Assets earnings using $964.4 million of net capital, a 13% required return and 3% long-term growth. Mature asset pricing and financial earnings can substitute for each other; every favorable assumption need not reach its most optimistic outcome simultaneously.
The strongest positive case uses asset pricing to offset lower financial returns
The strongest support for $16.93 does not require corporate cost cuts or a 10% Digital Assets capital return. Retain actual annualized corporate expenses and assume Digital Assets sustains $98.5 million of quarterly adjusted gross profit, corresponding to historically stronger ordinary-quarter performance. At the existing costs and tax assumption, annual after-tax earnings are approximately $43.27 million, a capital return of about 4.49%. If completed Helios assets can be capitalized at 6.5%, conditional value is still $17.84. Removing the corporate tax shield entirely leaves approximately $17.13.
This is material counterevidence to an overly cautious interpretation. Phase I has been delivered, Phase II funding has been arranged, and long leases with escalation have economic value. Reduced mature-asset risk could improve financing and pricing enough to support the reference share price with lower financial earnings. Focusing only on limited early distributions or weak ordinary quarters would miss that path.
It still requires two pieces of evidence: transactions or financing that support a 6.5% mature-asset capitalization rate, and repeated strong ordinary-quarter earnings rather than a single occurrence. Phase III's complete rent, budget and financing remain undisclosed, while tenant concentration and 2031 refinancing affect equity recovery. The public record explains how a favorable outcome can work without supporting a reliable probability for it.
Downside combinations also cannot be represented simply by adding isolated sensitivities. Construction delays, cost increases and a weak market could force fixed payments while resources lose value. In the existing combined stress calculation, remaining-lease LP value falls to approximately negative $840 million, with Class A value floored at zero for limited liability. Keeping the negative LP value visible shows the capital erosion. The combination has no assigned probability, and zero is not a share-price forecast.
The next assessment should follow actual delivery. The company's announcement schedules quarterly results for October 27. Phase I's first full quarter of rent, ordinary financial-business gross profit and expenses, and group funding changes will update this analysis. Subsequent evidence should connect Phase II hall deliveries with rent collection, establish Phase III financing, and show how usable resources meet debt maturities and tax distributions. Demonstrating both project returns and efficient use of shareholder capital would support a more positive judgment. Growth that repeatedly requires expensive financing would call for reassessing the value retained by existing shareholders.
Calculation choices and the limits of public information
Project cash flow deducts maintenance investment and normalized income tax after depreciation from NOI, then accounts for remaining construction and relevant net debt. Future cash flows share one valuation date. Spending allocated between June-end and the price date is a timing proxy, not disclosed actual Q3 payments. Phase III uses a $1.8 billion reference cost, with approximately $2.046 billion based on Phase II unit cost as a sensitivity. Full development valuation uses a $3.8 billion depreciable tax-basis proxy for Phase II; the completed-asset IRR comparison uses $4 billion. These serve different calculations, and neither is a verified tax balance.
The construction schedule assumes $5.150 billion remains to be invested from June-end. Its Phase II component starts with the $4 billion disclosed budget, subtracts an assumed $500 million already spent and removes a $200 million financing-cost proxy to avoid double counting separately modeled financing. Adding $50 million of Phase I completion payments and $1.8 billion for Phase III produces the total. The timing model allocates approximately $669 million before the reference price date and $4.481 billion afterwards. These are research estimates, not disclosed actual payments or a verified budget classification. The Q2 presentation, slide 16, provides the Phase II budget; the indenture, Section 1.01, establishes that Full Budgeted Cost includes financing and reserves. The remaining-spend deduction is central to the development equity values in the table.
The $205.540 million financing-and-repurchase deduction comprises $70.140 million of issuance discount and fees, a $110 million interim financing-cost proxy, and $25.400 million of disclosed repurchases. The $17.535 million issuance discount follows from the 99.5% issue price; the remaining $52.605 million of fees and the $110 million interim financing amount are research assumptions. The $1,488.131 million non-data-center capital proxy subtracts Inc. segment data center net assets of $995.990 million from LP book equity of $2,484.121 million. The entity scopes differ, so the result is not an audited standalone non-data-center net asset value.
The normalized completed-asset IRR starts at investment with $4 billion of cost, $548 million of initial rent and $46.8 million of staffing expense, both growing 3% annually. Initial debt is $3.507 billion, with 9.875% interest and annual amortization of 4% of original principal for the first three full operating years. Remaining debt is refinanced at year three at 8.5% with twelve-year level payments. Each financing incurs fees of 2% of debt, maintenance investment is 1% of rent, and tax is 21% with 20-year straight-line depreciation on completed asset cost. Maintenance expenditure receives neither an immediate deduction nor an additional future depreciation shield. The lease lasts fifteen years, with no renewal or residual value; equity funds negative cash flow. This comparison is separate from the actual bond calendar, and overrun cases increase depreciable tax basis accordingly.
Digital Assets continuing value equals net capital multiplied by the difference between after-tax capital return and long-term growth, divided by the difference between the required return and growth. At 10% return, 3% growth requires approximately $28.93 million of annual retention, leaving initially distributable earnings of about $67.51 million. The entire $96.44 million of after-tax earnings is therefore not available for Helios. Corporate costs and net adjustments containing proprietary rewards and internal eliminations are handled separately to avoid retaining both internal fee profit and full investment value.
This article uses public filings, contracts, company materials and regulatory documents. We conducted no management or expert interviews and no site visits. Company forecasts and our assumptions are identified where used; multiple disclosures from one company are not independent sources. Redacted lease schedules, Phase III's full budget and rent, account-level funding restrictions, Inc. net tax value, and future refinancing loan-to-value terms and fees remain important limits. Charts present disclosed data or calculations under stated assumptions, not guarantees of future outcomes.
This article is based on public information. Source dates, research assumptions and limitations are stated in the text. Review by professional investment or fund managers has not been confirmed. The publisher holds no investment-adviser licence. This article is not investment advice, an offer or a solicitation and is not tailored to any particular investor. Conditional calculations do not guarantee returns; past performance does not indicate future results.
Positions of the publisher and research participants in the subject or relevant counterparty securities: none; compensation related to this article: none; relevant business relationships or trading arrangements with the subject or its affiliates: none. Existing businesses include Expert Advisor trading software and VIP memberships, parameter presets and strategy source code, plus TopxAI AI-model API relay services and prepaid API credit cards. These businesses are unrelated to the research subject. This article is freely available and is not sold as a separate report. Material corrections will be dated at the top of the main-site article and reflected in its other published language or channel editions.